
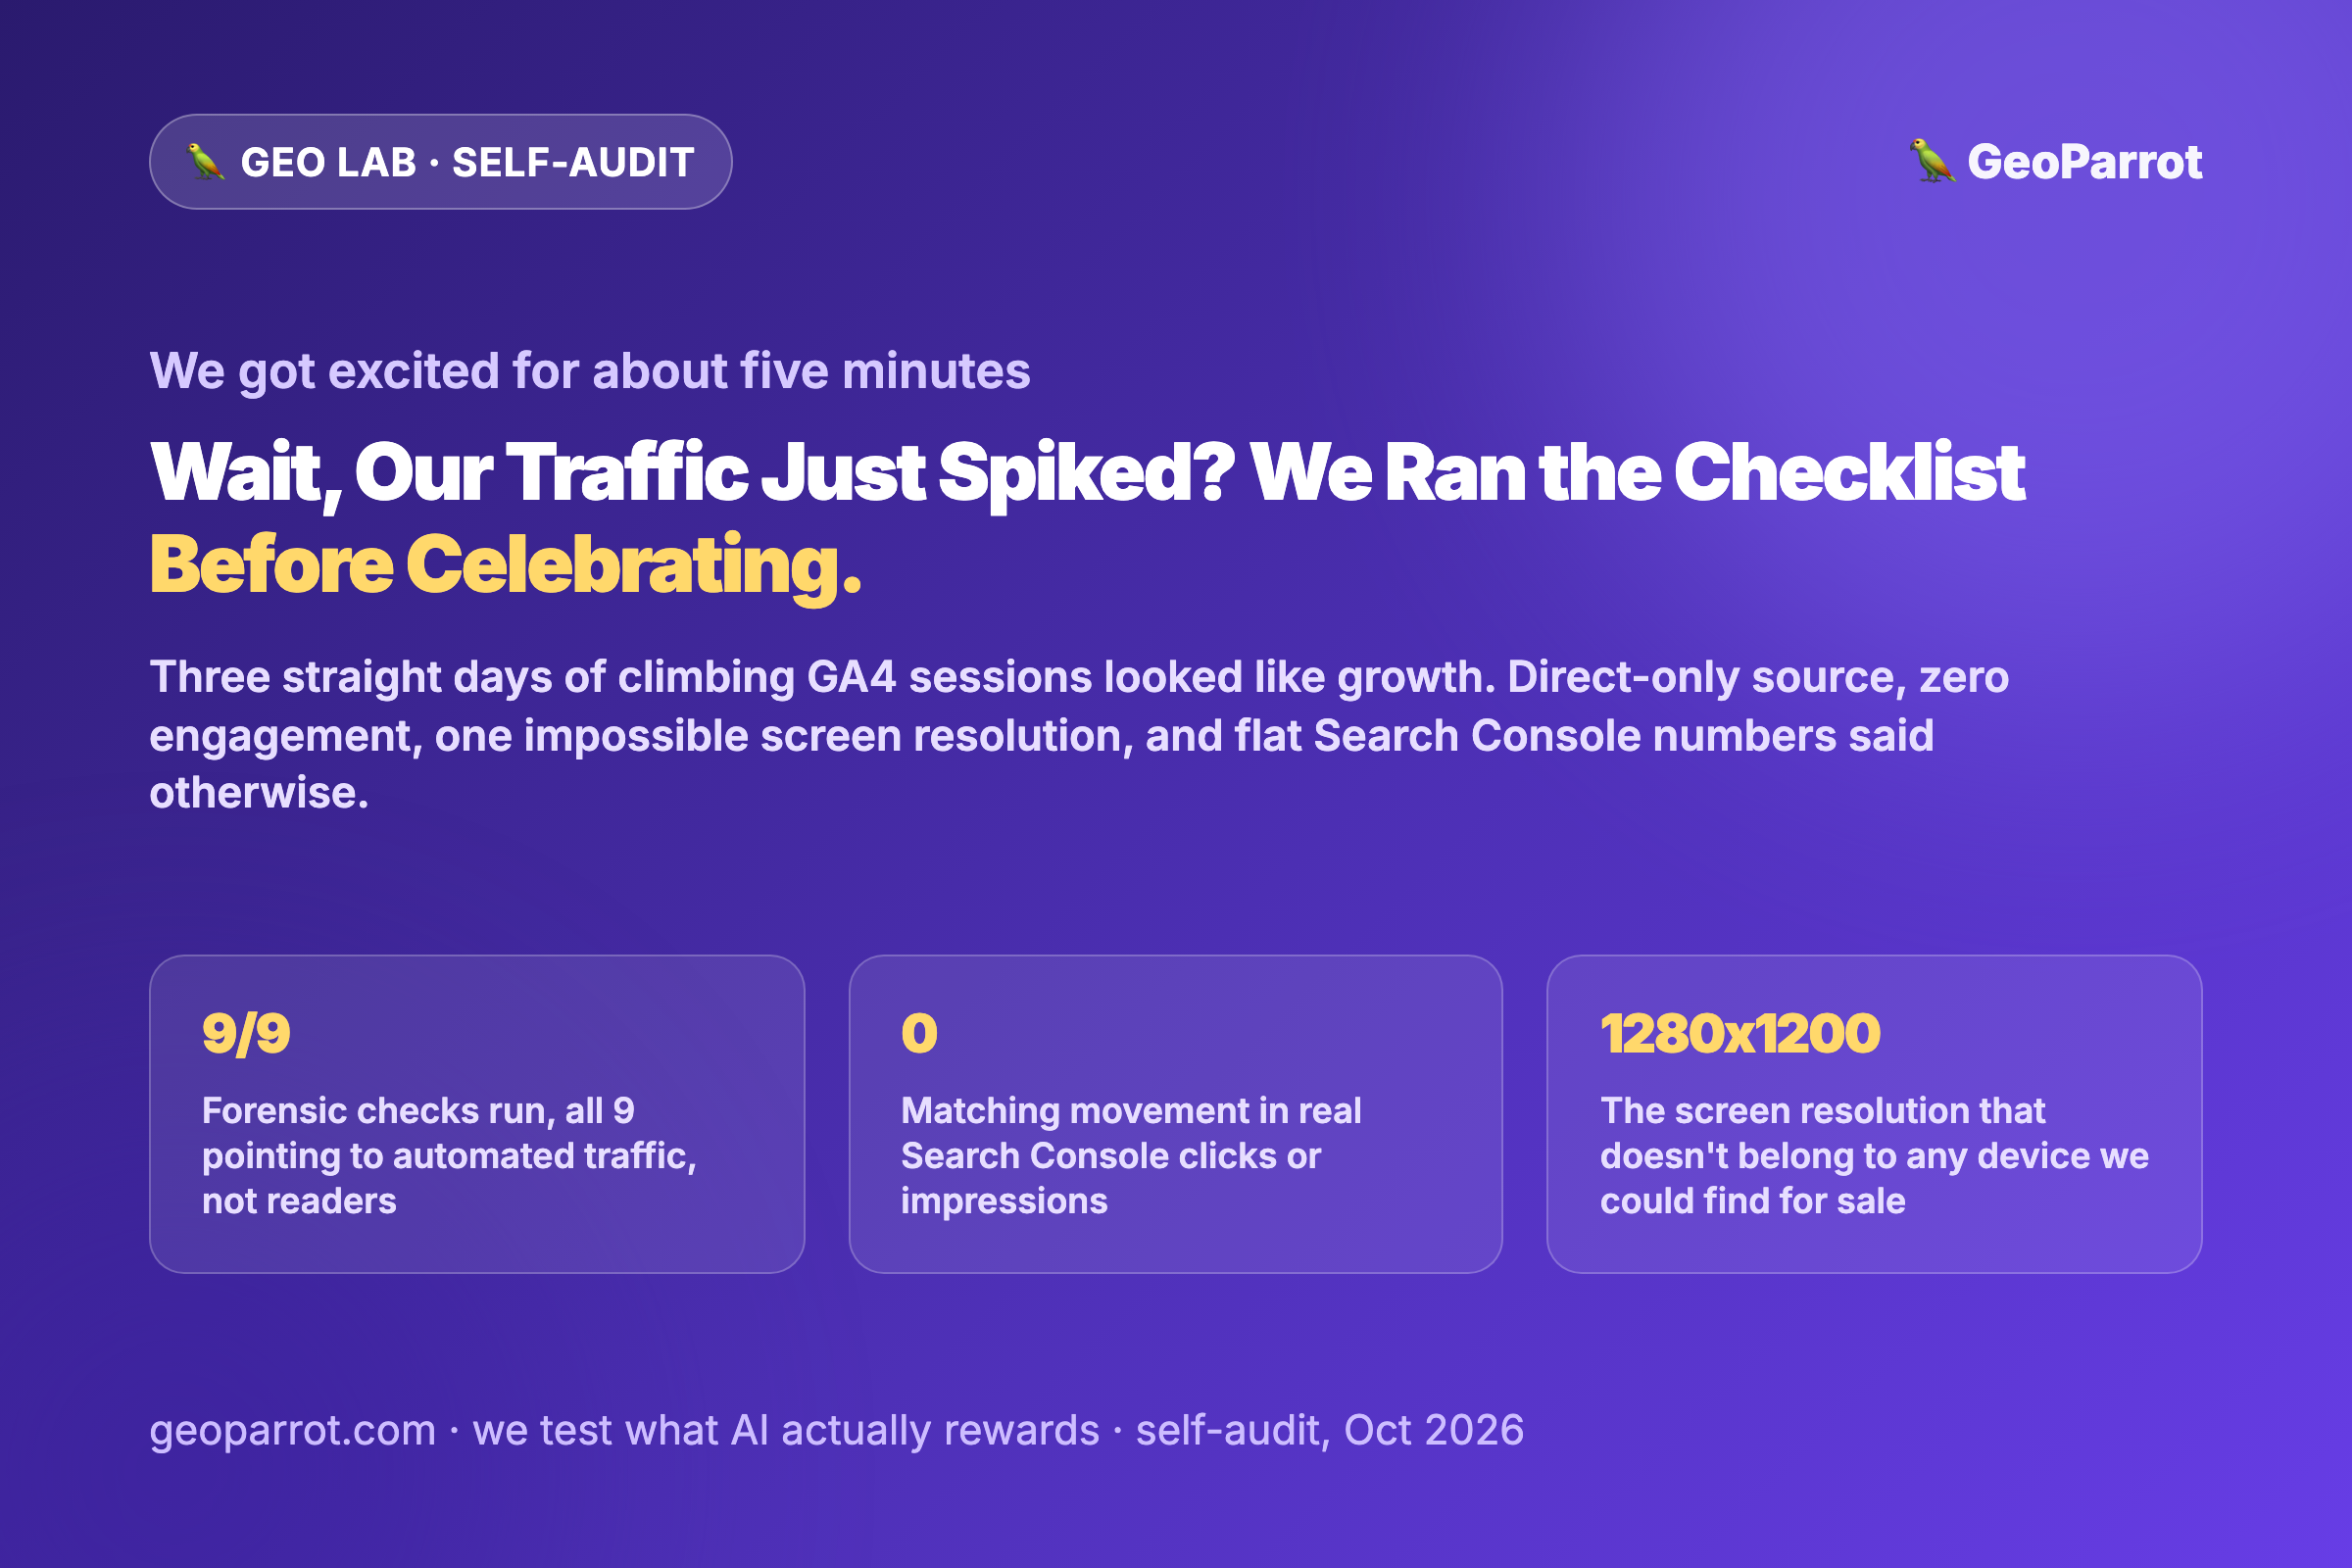
Quick answer: This week our own GA4 dashboard for GeoParrot showed sessions climbing for three days in a row, right in the middle of a normal publishing week — the exact shape of “the content is starting to work.” Before writing that down anywhere, we ran it through the same checklist we’d tell a reader to run on any suspicious spike: source/medium, device mix, engagement events, screen resolution, landing-page sequencing, new-vs-returning split, and geographic shape, then cross-checked it against a channel nothing can fake — Search Console’s real clicks and impressions. Every single signal pointed the same direction: automated, headless-browser traffic dressed up to look like a normal desktop visitor, not real readers. We’re publishing the method and the fingerprint, not the raw session counts, because the number doesn’t matter to you — the checklist does.
Self-audit — published October 31, 2026, in the GEO Lab. We run GA4 and Search Console audits on other brands’ sites constantly for this case study series. This time the dashboard in question was our own, which made it a good excuse to document the full checklist end to end instead of summarizing it.
What did the dashboard actually show?
Nothing dramatic enough to screenshot and brag about, which is exactly what made it believable. Sessions moved up on each of three consecutive days, a shape that looks identical to “a piece of content is getting traction” or “a backlink started sending referrals.” No single-day cliff, no obviously fake number — just a steady, plausible-looking line. That’s the version of a fake spike that’s actually dangerous, because the suspicious ones (a 50x jump overnight) get checked by instinct. The believable ones don’t.
The checklist we ran before trusting it
This is the same sequence we use when auditing a client or case-study site for inflated traffic claims. Every item below is a ratio or a pattern, not a raw count, which is also why we can publish all of it without publishing the actual numbers.
| Check | What a real traffic increase looks like | What we actually found |
|---|---|---|
| Source / medium | A mix — organic search, some direct, some referral or social | Essentially all of it landed as “(direct) / (none)” — no referrer at all |
| Device category | A realistic mobile/desktop split for the audience | Desktop only, with no mobile or tablet sessions in the window |
| Engagement events | Scroll, click, and engagement pings on a meaningful share of sessions | Page view and session-start fired almost every time; scroll or engagement events fired on only a handful |
| Bounce / engagement rate | Some spread — a mix of quick exits and longer reads | Engagement rate near zero, average session duration measured in hundredths of a second |
| Screen resolution | A spread of resolutions matching real laptops, monitors, and phones in the market | One resolution dominated that doesn’t match any consumer device we could find for sale — a known default viewport size for headless browser automation tools |
| Landing page sequence | Readers land on articles, maybe browse a category page next | A chunk of sessions landed on internal search result pages with page-number parameters jumping non-sequentially (page 1, then 4, then 6, then 11, then 16) — a pattern that enumerates a site’s URL list, not a pattern a human clicks |
| New vs. returning | A mix, with some repeat visitors if the content is actually building an audience | Effectively 100% new, zero returning sessions |
| Geographic shape | Concentrated in the markets your content and distribution actually target | One dominant country that scaled up in exact proportion to the total each day, plus a long tail of single-session hits from a dozen-plus unrelated countries |
| Cross-check: Search Console | Real organic growth shows up as rising clicks and impressions too | Clicks and impressions stayed completely flat across the same days — no corroborating signal from the one channel that’s hardest to fake |
So what actually was it?
A headless browser, or a fleet of them, requesting real pages on our real domain and executing enough JavaScript to fire our GA4 tag — while never behaving like a person once it landed. The “(direct) / (none)” source isn’t a fake referrer being spoofed; it’s simply what GA4 logs when there’s no referrer at all, which is consistent with a script opening a URL directly rather than clicking a link. The internal-search pagination trail is the clearest tell: it’s the footprint of something systematically walking a site’s content list, the way a scraper or a monitoring tool would, not the way a reader browses.
Is that good or bad for a site that’s literally about getting cited by AI?
We get asked this a lot when we explain the finding, so it’s worth answering directly: it’s not good, and it’s a mild negative rather than a disaster. The one scenario where this would be good news is if the traffic were an official AI crawler — GPTBot, ClaudeBot, PerplexityBot, and similar — since GeoParrot’s robots.txt already allows all of them and more citation-crawler traffic is squarely the point of this site. But those crawlers identify themselves honestly in their user agent and typically fetch raw HTML rather than spinning up a full headless browser to execute JavaScript. What we found disguises itself as an ordinary Chrome/Windows visitor and pages through search results the way a scraper or a competitive-monitoring tool would. That doesn’t threaten the site (the volume isn’t close to anything that would strain hosting), but it also doesn’t help it, and treating it as reader growth would have been a straightforwardly wrong read on our own performance.
What we did about it
Nothing dramatic, on purpose. We didn’t change strategy, didn’t block anything at the server level, and didn’t treat the spike as a signal that some piece of content or distribution channel suddenly started working. The only action was the correct one: not letting a fake number update our belief about what’s actually driving the business. If the pattern grows heavier or starts affecting page load for real visitors, a server-level block (Cloudflare or similar) is the next lever — but that’s a decision based on cost, not panic.
The checklist, if your own dashboard does this
- Don’t react to the top-line number first. Break any sudden session increase down by source/medium, device, and new-vs-returning before you draw a conclusion from it.
- Check engagement events, not just sessions. A real audience generates scroll and engagement pings on a meaningful share of visits. If almost every session fires only page_view and session_start, that’s a red flag on its own.
- Look at screen resolution. One unusual resolution dominating your traffic, especially one that isn’t sold in any real device, is one of the cleanest automation fingerprints available in standard GA4 reporting — no extra tooling required.
- Check the landing-page sequence for anything that enumerates your site. Internal search or pagination parameters being hit out of human order (page 1, then page 11, then page 4) is a scraper signature, not a reading pattern.
- Cross-check against a channel that’s harder to fake. Search Console clicks and impressions, server logs, or a second analytics tool entirely. Real growth tends to show up in more than one place at once; a single dashboard’s isolated climb is the more common failure mode.
Frequently asked questions
How do I tell if a traffic spike in GA4 is bot traffic?
Check source/medium (bot traffic is often entirely “(direct) / (none)”), engagement events (real sessions generate scroll and engagement pings; bot sessions often fire only page_view and session_start), screen resolution (a single unusual resolution dominating is a strong automation signal), and the landing-page sequence (internal search or pagination hit out of human order suggests a scraper). Then cross-check against Search Console or another independent data source before trusting the spike.
Does GA4’s built-in bot filtering catch this automatically?
GA4 filters known bots from a standard list (the IAB/ABC international spiders and bots list) by default, but that list doesn’t cover every automation tool, especially newer headless-browser scrapers and monitoring services that render pages like a real browser. Traffic that executes JavaScript convincingly enough to fire your analytics tag can still get through.
Is a screen resolution like 1280×1200 really a reliable bot signal?
On its own, no single signal is conclusive. But a resolution that isn’t shipped on any current consumer laptop, monitor, or phone — and is instead a commonly used default viewport size for browser automation frameworks — dominating your traffic is a strong indicator when it shows up alongside zero engagement, 100% new users, and no referrer.
Is bot traffic good or bad for a site focused on AI search visibility?
It’s a mild negative, not a win, unless the traffic is specifically an identified, officially disclosed AI crawler (GPTBot, ClaudeBot, PerplexityBot, and similar), which behaves differently and typically doesn’t need to render a full headless browser to read a page. Generic scraper or monitoring traffic disguised as a normal browser doesn’t help citation chances and simply pollutes your analytics if you don’t filter it out.
Should I block this kind of traffic at the server level?
Only if the volume is heavy enough to affect real visitors’ load times or hosting cost. At low volume, the more urgent action is simply not letting it distort your read on real growth — treat it as a measurement problem to exclude, not a threat to respond to.





Leave a Reply