
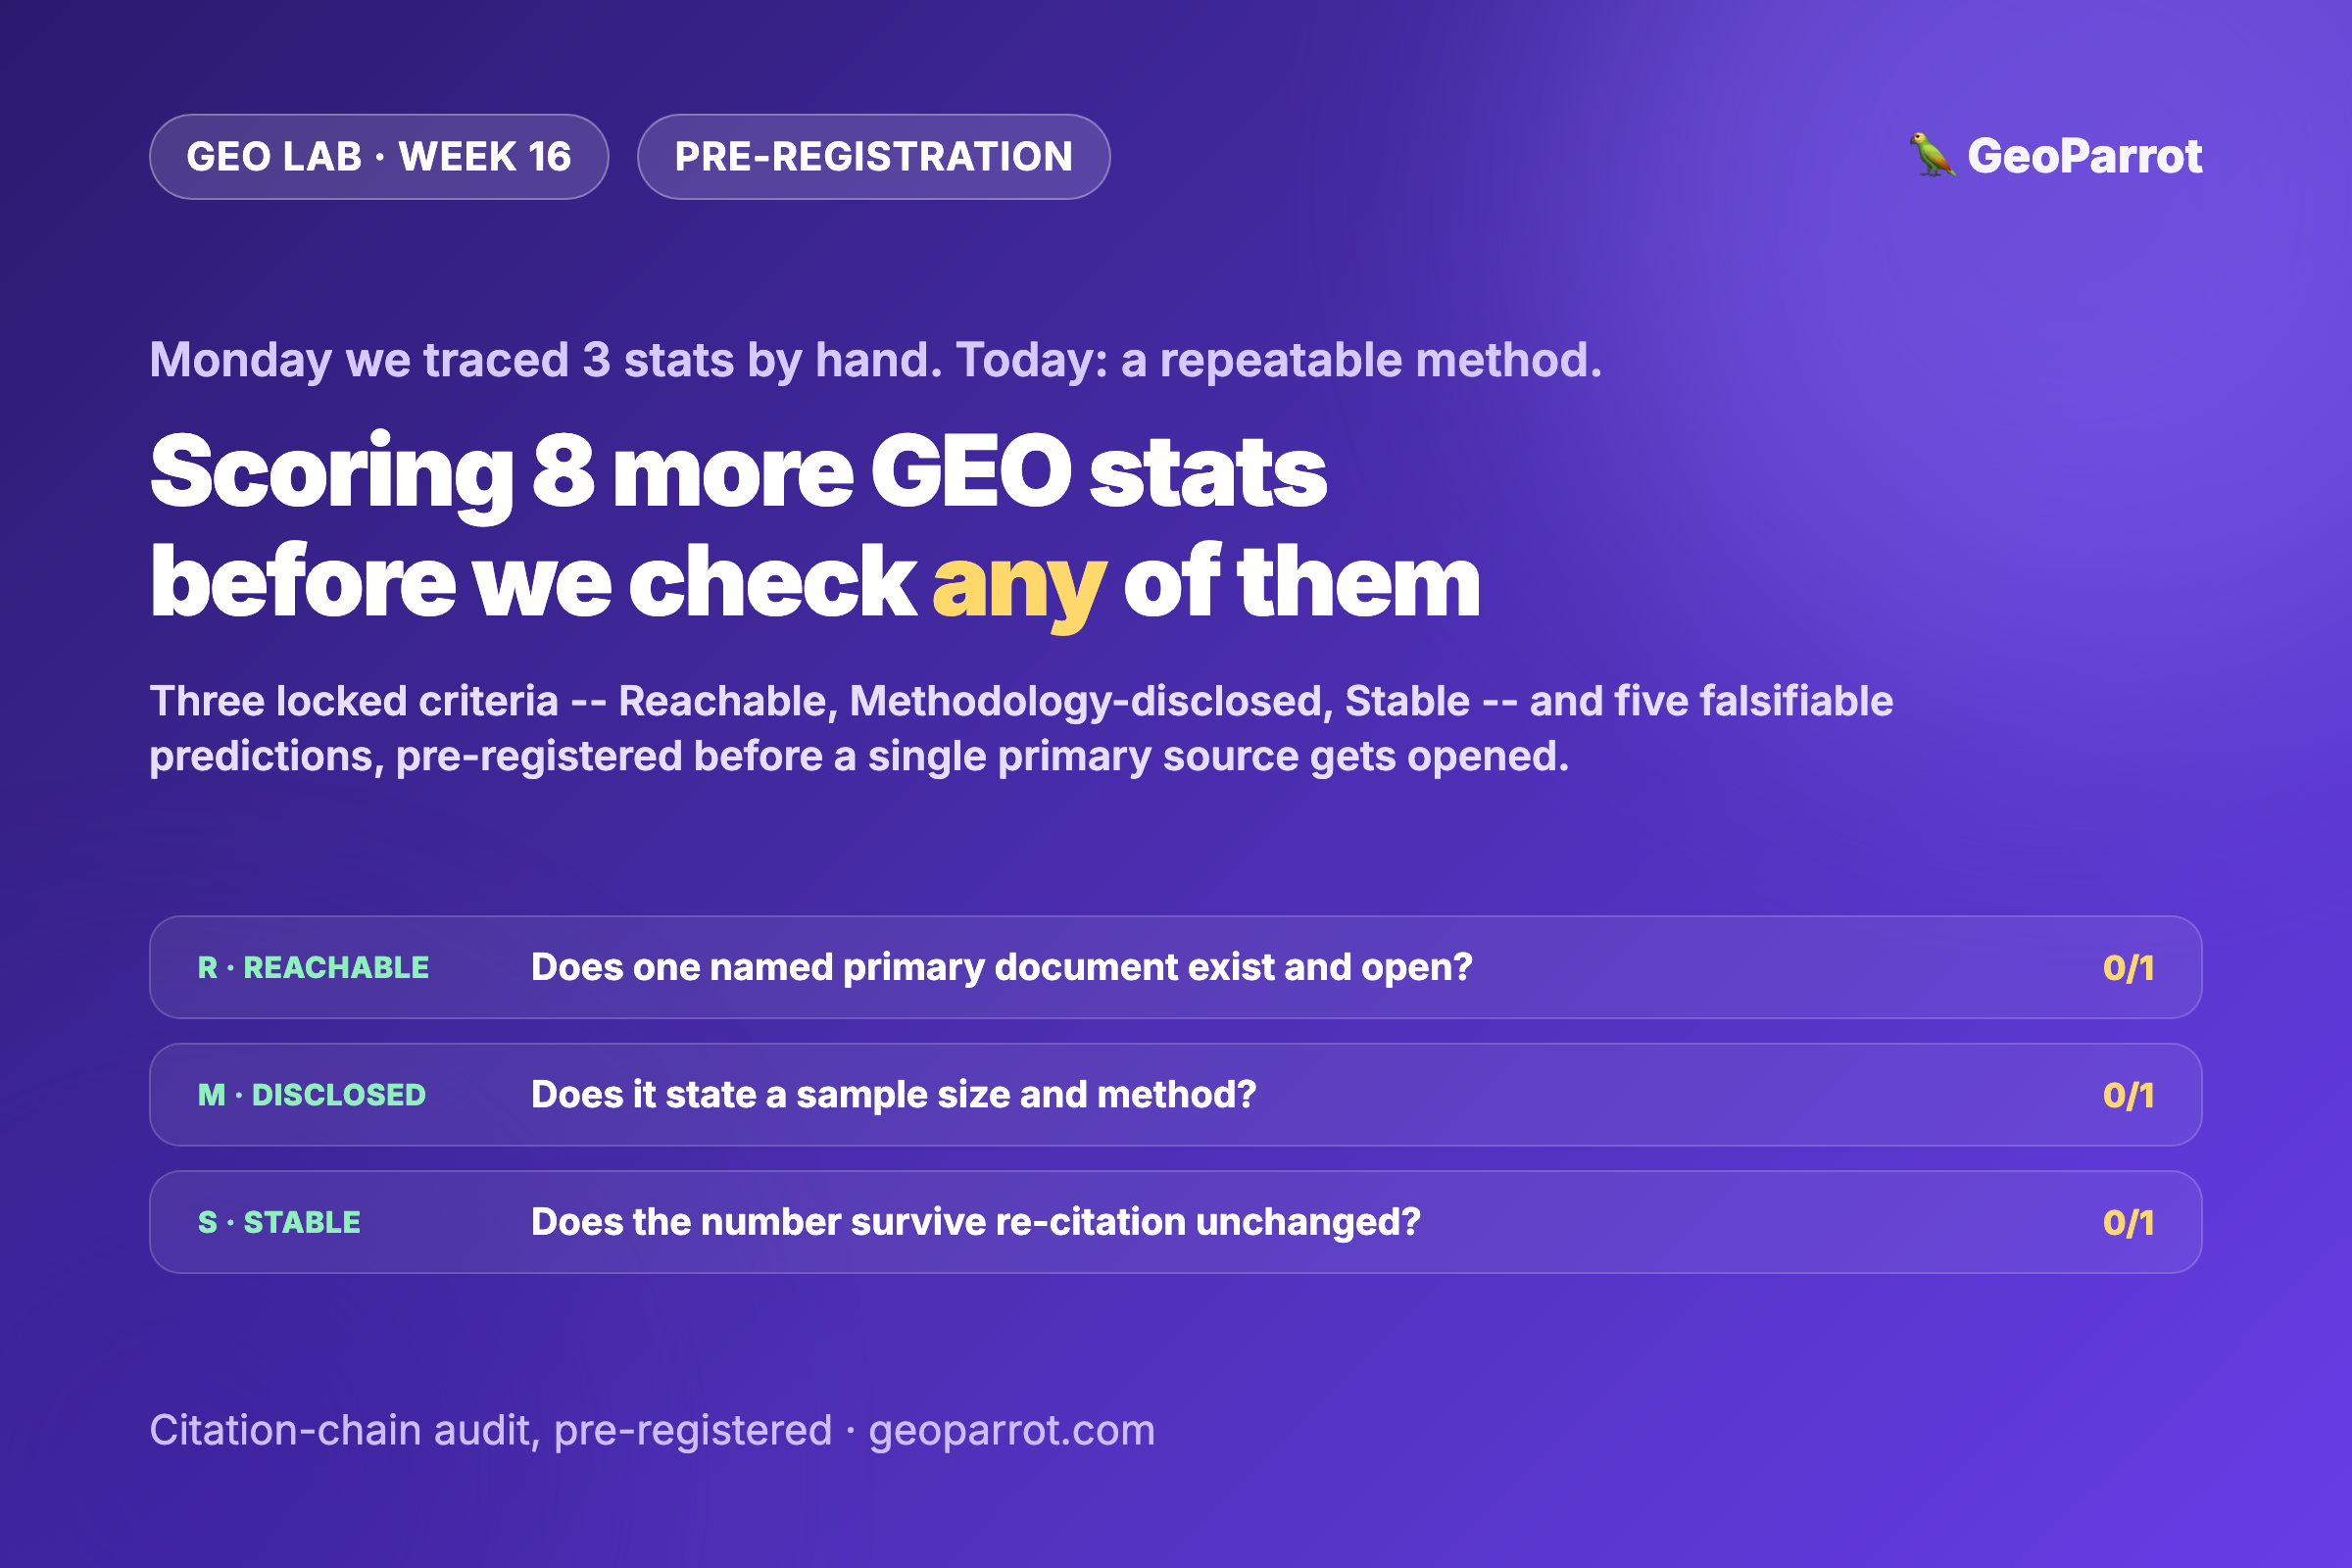
Quick answer: Monday we manually traced three of October’s most-repeated GEO citation stats back to their primary sources. One (a 3.2× freshness multiplier) resolved to a citation of a citation with no checkable document behind it. One (Presence AI’s author-attribution research) disclosed real sample size and methodology. And one got its own numbers invented by our search tool mid-session, before we caught it against the primary source. That was three claims, checked by hand. Today we turn the same check into a repeatable method: three binary criteria — Reachable (does a single named primary document exist and open?), Methodology-disclosed (does it state a sample size and method?), Stable (does the number survive being re-cited by independent outlets without drifting?) — scored 0–3 per claim. We’re locking the method and five falsifiable predictions against 8 more stats currently circulating in GEO content before we score any of them. Scoring happens Wednesday.
Experiment design — published October 6, 2026, in the GEO Lab. This is a pre-registration: the claim population, the exact scoring rules, and five numbered predictions go out now, locked, before we open a single primary source. We collect and score Wednesday, publish the full score sheet Thursday, and judge the five predictions against it Friday.
What claim are we testing this week?
The hypothesis inherited from Monday, stated so it can lose: the citation-chain problem we found in three stats wasn’t bad luck in our sample — it’s a structural feature of how GEO content repeats numbers, and it will show up again in a fresh, independently-selected set of claims. If that’s true, most widely-repeated GEO stats will fail at least one of the three checks below, and the failures won’t be random — they’ll cluster around a specific pattern: claims whose only visible source is a company’s own marketing report or an aggregator round-up, rather than a named, peer-reviewed, or journalistically-sourced analysis.
The counter-hypothesis: Monday’s sample was unlucky, cherry-picked, or simply small (n=3). A broader, independently-pulled set of 8 claims might mostly check out once we actually open the primary documents — meaning the GEO industry’s citation hygiene is better than one spot-check suggested. Both are plausible going in. This experiment is built to make the data pick a side, on a claim population we did not choose to make Monday’s point look better.
Which 8 claims are getting audited, and where did we pull them from?
We pulled the population the same way anyone encountering “GEO statistics” content would: searching for the numbers currently circulating across GEO/AEO statistics round-ups and citation-report write-ups in October 2026, then keeping the ones that recur across more than one outlet. That selection method is itself a limitation we flag below — it biases toward numbers aggregators like to repeat, not necessarily the most consequential ones. Here is the locked list, with the number as currently stated and how it’s attributed where we found it:
| # | Claim | As currently attributed |
|---|---|---|
| 1 | Earned media = 84% of AI citations; professional journalism 27%; paid/advertorial content 0.3% | Named report: Muck Rack, May 2026, “25M+ links cited by ChatGPT, Claude and Gemini” |
| 2 | On Perplexity, 64% of URLs never get cited; top 6% of URLs capture ~half of all citations | “An analysis of 1M+ citations published February 2026” — no single publisher named in the round-ups repeating it |
| 3 | The 31% of ChatGPT-cited URLs with a 2.0+ citation rate account for 59% of all citations | Surfaces via a secondary “6-study data analysis” aggregator, not one named primary study |
| 4 | 52% of listicles on ChatGPT achieve high (2.0+) citation rates, despite being under a fifth of cited URLs | Same aggregator as #3 |
| 5 | 44% of Google’s top SaaS brands are invisible to ChatGPT | Named report: EMG Group, “SaaS AI Citation Gap Report 2026” |
| 6 | Of 500 brands analyzed, only 72 (14.4%) earned at least one AI citation on priority queries | Named report: “The 2026 AI Citation Report,” TheReviewMakers |
| 7 | Adding quotations lifts AI-citation likelihood up to +41%; adding statistics +30–40%; citing sources +30% | Named academic paper: Aggarwal et al., KDD 2024 — predates the 2026 GEO-blog wave now re-citing it |
| 8 | Reddit = 22% of AI citations, second only to brand-owned sites (33%), ahead of Wikipedia (19%) | Surfaces across multiple round-ups with no single consistently-named primary source |
That last point is worth sitting with. Half of this list already shows the pattern Monday’s “GrowByData” case did — a number repeated confidently across several outlets with no single document anyone points to by name. We haven’t scored anything yet; that’s just what the population itself looks like before scoring starts.
How do we score “citation hygiene” so it’s not just vibes?
Three binary criteria, applied in order, each worth one point — a claim’s score is 0 to 3:
- R — Reachable. Does a single, named primary document (a report, paper, or dataset — not a secondary blog quoting it) exist and open? Score 0 if the chain only resolves to “a study” or an aggregator round-up with no one document behind it, the way Monday’s 3.2× freshness stat did.
- M — Methodology disclosed. Having reached the primary document (R=1 required first), does it state a sample size and a method — what was counted, on which platforms, over what window? Score 0 if the number stands alone with no disclosed basis, the way Monday’s “3×” freshness claim did even from a credible named author.
- S — Stable under re-citation. Searching independently for the claim, do at least two other outlets repeating it state the exact same number, attributed to the exact same basis? Score 0 if the figure rounds differently between re-citations, gets attached to a different source, or quietly swaps which sub-metric it’s describing — the kind of drift our own search tool produced for the Presence AI numbers mid-session last week.
A claim can score R=1 but M=0 (a named, open report with no disclosed sample — this is the position Monday’s AirOps/Kevin Indig stat was in). It can’t score M=1 with R=0: if there’s no single primary document to open, there’s nothing to check a methodology section against. We report R, M, and S separately per claim, plus the composite 0–3, because collapsing them into one number would hide exactly which link in the chain broke.
What five predictions are we locking before scoring?
Pre-registered, numbered, each falsifiable. If Thursday’s data contradicts one, Friday’s verdict says so in plain language.
- P1 — Most claims fail at least one leg. 5 or fewer of the 8 claims score a full 3/3. This is the load-bearing prediction: if 6 or more score 3/3, Monday’s finding was a sampling fluke, not a pattern, and we were wrong to generalize from it.
- P2 — Named-source attribution predicts reachability. All four claims arriving with a single named report attached at the outset (#1, #5, #6, #7) score R=1. At least two of the four claims arriving only through aggregator round-ups (#2, #3, #4, #8) score R=0. Attribution clarity going in predicts whether a primary document exists at all.
- P3 — The academic paper discloses the most. Claim #7 (Aggarwal et al., KDD 2024) scores M=1, and does so more convincingly — with more specific method detail — than any of the three company-report claims (#1, #5, #6) that also reach R=1. Peer-reviewed venues require method sections; marketing reports don’t have to.
- P4 — At least a quarter of the set shows visible drift. 2 or more of the 8 claims score S=0 — the number or its stated basis changes between independent re-citations we can find. This is the direct replication target for what happened to the Presence AI numbers inside our own research tool last week, just found in the wild instead of in our own process.
- P5 — Sample size doesn’t predict reachability. Whether a study claims 1,200 pages or 25 million links has no visible relationship to whether R=1. Claim #1 (25M+ links, named report) and claim #6 (500 brands, named report) should both reach R=1 regardless of their very different scale, while claim #2 (1M+ citations, no named publisher) should stay R=0 despite its large claimed N. Scale of the underlying study is not what determines whether a reader can check it — a named, linkable publisher is.
Together these predict one shape: citation hygiene in GEO content tracks who published the number and how they framed it going in, not how big or official the underlying study sounds. A fluent percentage with a scary N attached isn’t evidence of checkability — a named, open, method-disclosing document is. If P1 fails and most of this fresh set scores clean, we were wrong to generalize from three stats, and Friday says so.
What already happened to this list before we even started scoring?
One thing, worth disclosing now rather than saving for Thursday. Building this claim population took two separate search passes. Both independently returned the Muck Rack figure (claim #1) with identical specifics — 84%, May 2026, “25M+ links,” ChatGPT/Claude/Gemini — word for word close enough that it reads as the same underlying index being queried twice, not two different sources independently confirming the number. That’s not a result; it’s not an S=1 under our own rule, because two calls to the same search tool aren’t two independent outlets. We’re flagging it so nobody mistakes “we saw it twice” for “we verified it” once Wednesday’s scoring starts — which is exactly the shortcut that let Monday’s 3.2× stat travel as far as it did before anyone checked it.
What could make this audit misleading — and how do we stay honest?
Four limits, named in advance. One: the population itself is drawn from aggregator round-ups — the exact kind of secondary layer this audit is designed to scrutinize — so it’s biased toward numbers that get repeated often, not necessarily toward the claims that matter most for a GEO decision. Two: “Reachable” has degrees we’re collapsing into a binary. A report that’s fully public and one that’s gated behind an email form are different kinds of friction; we’ll note borderline cases in the write-up rather than silently force them into 0 or 1. Three: “Stable” depends on what else is findable — if a claim simply hasn’t been re-cited anywhere else yet, we can’t score drift either way, and we’ll say so rather than default it to a pass. Four: we are the same team whose own tool mangled a number mid-session last week — so if Thursday’s score sheet has an error, that’s not a hypothetical risk, it’s the base rate we just demonstrated on ourselves. Anyone is welcome to re-run this list and check our scoring the way we’re checking the industry’s.
We’re pre-registering this in the open, same as the rest of the GEO Lab, because the result that flatters us — “most of the industry’s stats don’t survive a source check” — is the one we’d be tempted to go looking for. The locked claim list and the five numbered predictions exist so the data can still embarrass us if the broader sample turns out cleaner than Monday’s. Scoring happens Wednesday; the full score sheet publishes Thursday; Friday judges all five predictions against exactly what’s written here.
Frequently asked questions
What is this audit actually testing?
Whether the citation-chain problem found in three GEO stats on Monday (an unreachable study, a methodologically transparent one, and a drifted number) generalizes to a fresh, independently-pulled set of 8 widely-repeated GEO statistics — scored with a repeatable method instead of a one-off manual check.
How is the citation hygiene score calculated?
Three binary checks, worth one point each: Reachable (a single named primary document exists and opens), Methodology-disclosed (that document states a sample size and method), and Stable (the number survives being re-cited by at least two independent outlets without drifting). Composite score 0–3 per claim, reported alongside the three individual checks.
Why these 8 claims specifically?
They’re numbers that recur across more than one GEO/AEO statistics round-up published in October 2026 — the same way a reader would encounter them. That selection method is itself flagged as a limitation: it favors numbers aggregators repeat often, not necessarily the ones that matter most.
What result would mean Monday’s finding was a fluke?
If 6 or more of the 8 claims score a full 3/3 — fully reachable, methodology-disclosed, and stable — that means the three stats checked Monday were an unlucky sample, not evidence of a broader pattern, and our locked prediction (P1, 5 or fewer at 3/3) would be wrong.
When do the results publish?
We score all 8 claims Wednesday and publish the full score sheet Thursday with the per-claim R/M/S breakdown, then a verdict Friday that judges each of the five predictions against exactly what’s written here. Nothing in the claim list or scoring rules changes once scoring starts.
Sources
- Do GEO Citation Stats Survive a Source Check? — Monday’s manual trace of three stats that set up this week’s method.
- Counted vs. inferred GEO metrics — the broader distinction between numbers someone actually counted and numbers that are inferred or re-inferred downstream.
- Query phrasing citation experiment design — the same pre-registration format (locked claims/predictions before collection) used two arcs ago.
- AI citation decay experiment verdict — an earlier GEO Lab test that stayed honest about an inconclusive result instead of reframing it after the fact.
- Why source-mix volatility is a structural feature — related finding on why single-snapshot citation numbers move on their own.
- Do 15 domains control AI citations? — the concentration data behind claim #8’s Reddit/brand-share comparison.
- Earned beats owned — context for claim #1’s earned-media figure.
- GeoParrot GEO Lab — pre-registered scoring method; 8 claims, three binary criteria (Reachable, Methodology-disclosed, Stable), scoring to follow Wednesday.
GeoParrot is a GEO Lab: we test what AI search actually cites and recommends, then publish the method and the misses — including our own. This is a Tuesday pre-registration in a four-part weekly arc — Monday set the hypothesis; Wednesday we score; Thursday the data; Friday the verdict.
Leave a Reply