
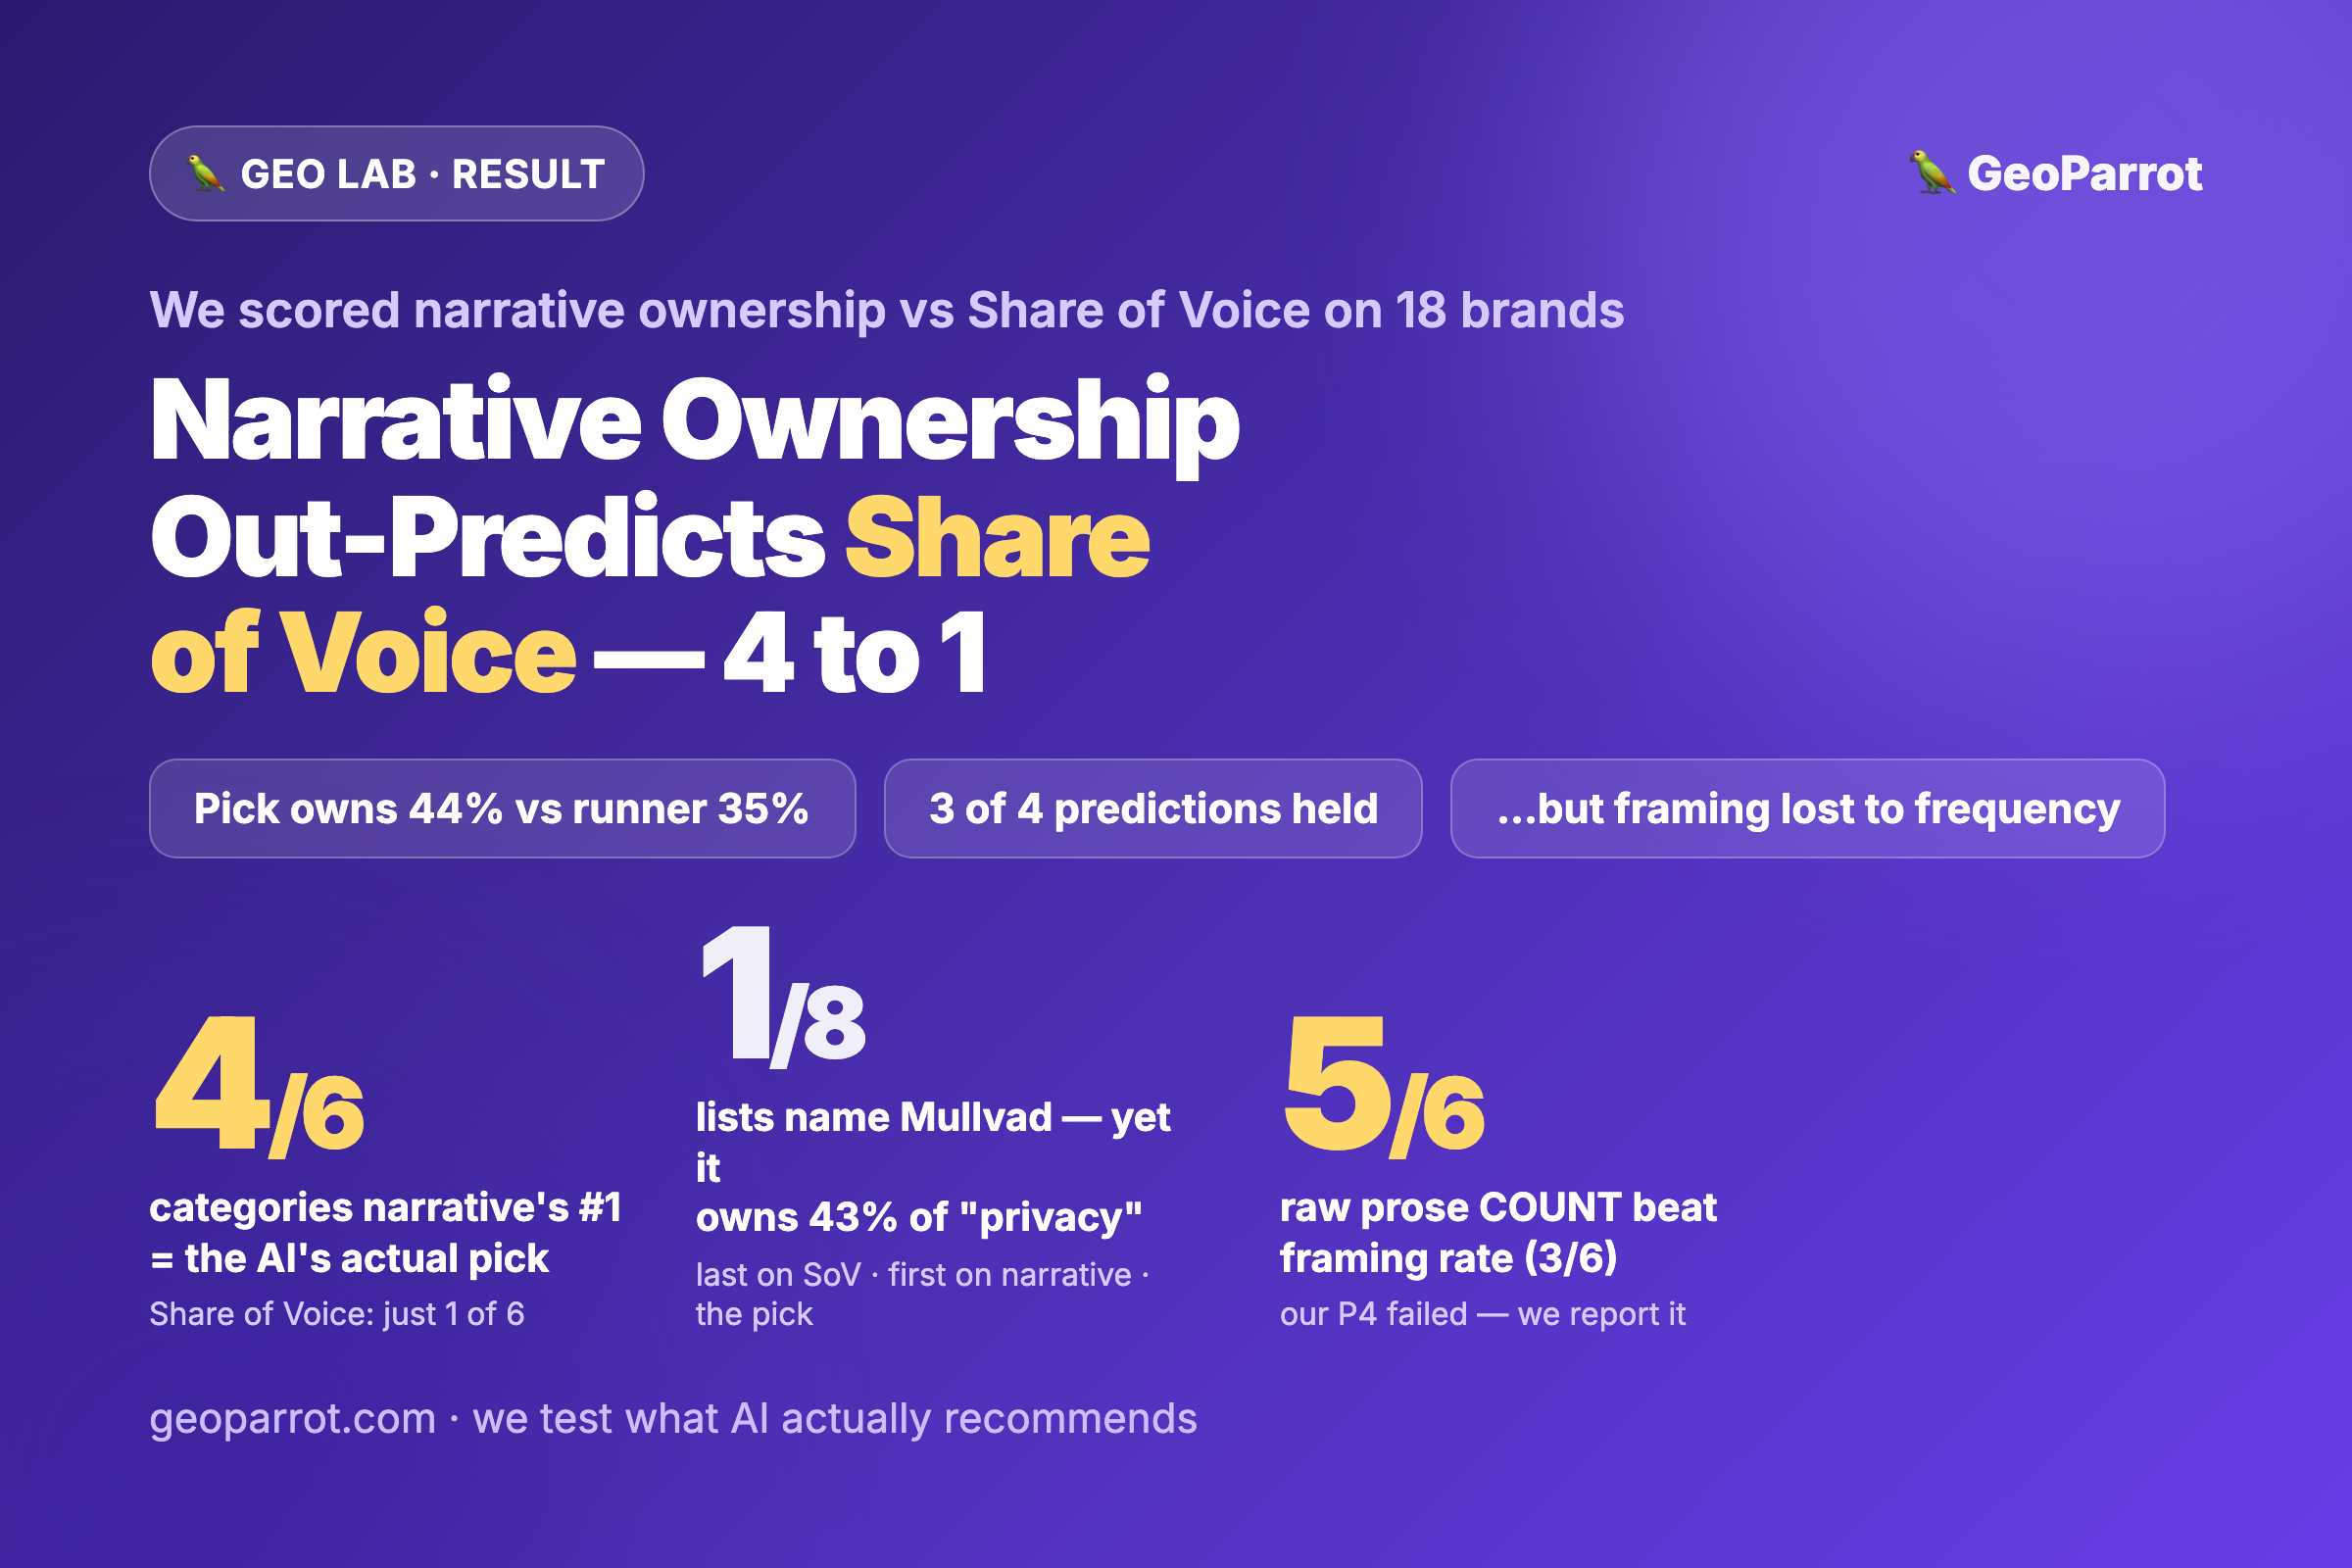
Quick answer: We coded 18 brands across 6 buyer-intent categories — each labelled a consensus pick, runner-up, or challenger — against the narrative-ownership scoring we pre-registered on Tuesday, and three of our four predictions held. Narrative ownership separates the tiers: picks own 44% of their category’s defining-attribute language on average, runners-up 35%, challengers 22%, and the pick out-owns its runner-up in 4 of 6 categories (our locked threshold). It out-predicts Share of Voice: the narrative-ownership #1 brand is the AI’s actual pick in 4 of 6 categories versus Share of Voice’s 1 of 6. And Mullvad is the clean reversal — dead last on Share of Voice (on just 1 of 8 VPN lists) yet first on narrative ownership of “privacy,” and it is the engines’ pick. But the fourth, self-critical prediction failed: we bet that framing (attribute-association rate) would beat frequency (raw mention count), and it didn’t — raw prose count predicted the pick in 5 of 6 categories, ahead of our framing-rate measure at 3 of 6. So narrative ownership is a real, measurable signal that beats Share of Voice — but part of why it works is still plain volume, not pure framing. We report the win and the miss.
This is Thursday’s result in this week’s GEO Lab arc. Monday we showed Share of Voice ranks the AI’s runner-up ahead of the winner and named “narrative ownership” as the lever; Tuesday we published the scoring method and four predictions before coding a single mention. Today we run the numbers — including the one prediction the data refused to confirm.
Does narrative ownership separate the pick from the runner-up?
Yes — and cleanly across tiers. We froze each category’s defining attribute from a neutral buyer guide before scoring any brand (VPN → privacy/no-logs, help desk → omnichannel ticketing, and so on), then counted each brand’s share of that attribute-language in the same independent corpus Share of Voice was counted on. Averaged across categories, consensus picks own 44% of their category’s attribute-language, runners-up 35%, and challengers 22% — a monotonic ladder that Share of Voice’s breadth count never produced (there, runners-up sat on as many or more lists than the picks).
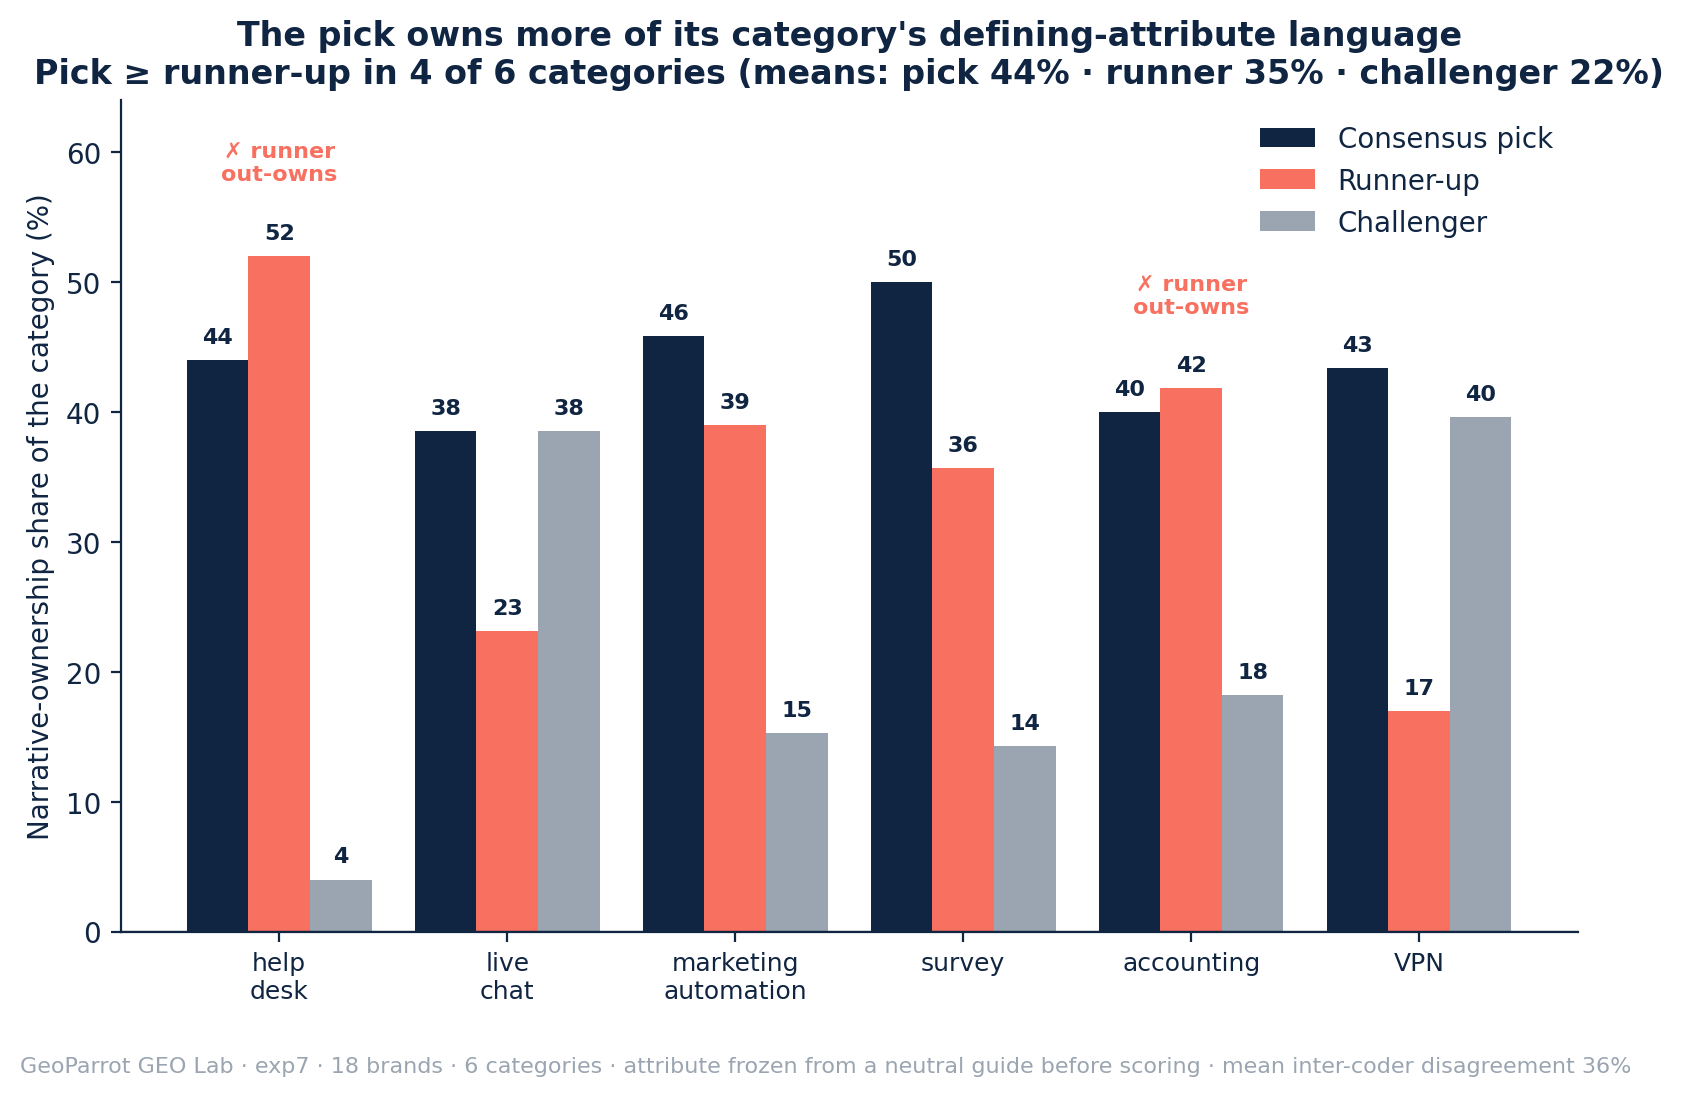
Our first pre-registered prediction — the pick out-owns its runner-up in at least 4 of 6 categories — landed exactly on the line. Picks lead in live chat, marketing automation, survey and VPN. The two honest misses: help desk (Zendesk owns 44% of “omnichannel ticketing” language vs Freshdesk’s 52%) and accounting (QuickBooks 40% vs Xero 42% on “reporting/financial visibility”). Both are narrow, and both are categories where the runner-up is a genuinely close second in the engines’ eyes — but we’re not going to round them in our favour. Four of six, threshold met, not exceeded.
Does narrative ownership out-predict Share of Voice?
This was the decisive test — the one that could have killed the whole hypothesis. For each category we take the #1 brand by each metric and ask a single question: is it the brand the engines actually recommend? The bar was public and low: last week Share of Voice’s own breadth leader was the pick in just 1 of 6 categories. Narrative ownership had to clear that by a clear margin, and it did — its top brand is the AI’s actual pick in 4 of 6 categories (3 of 6 if we refuse to count ties), four times Share of Voice’s rate.
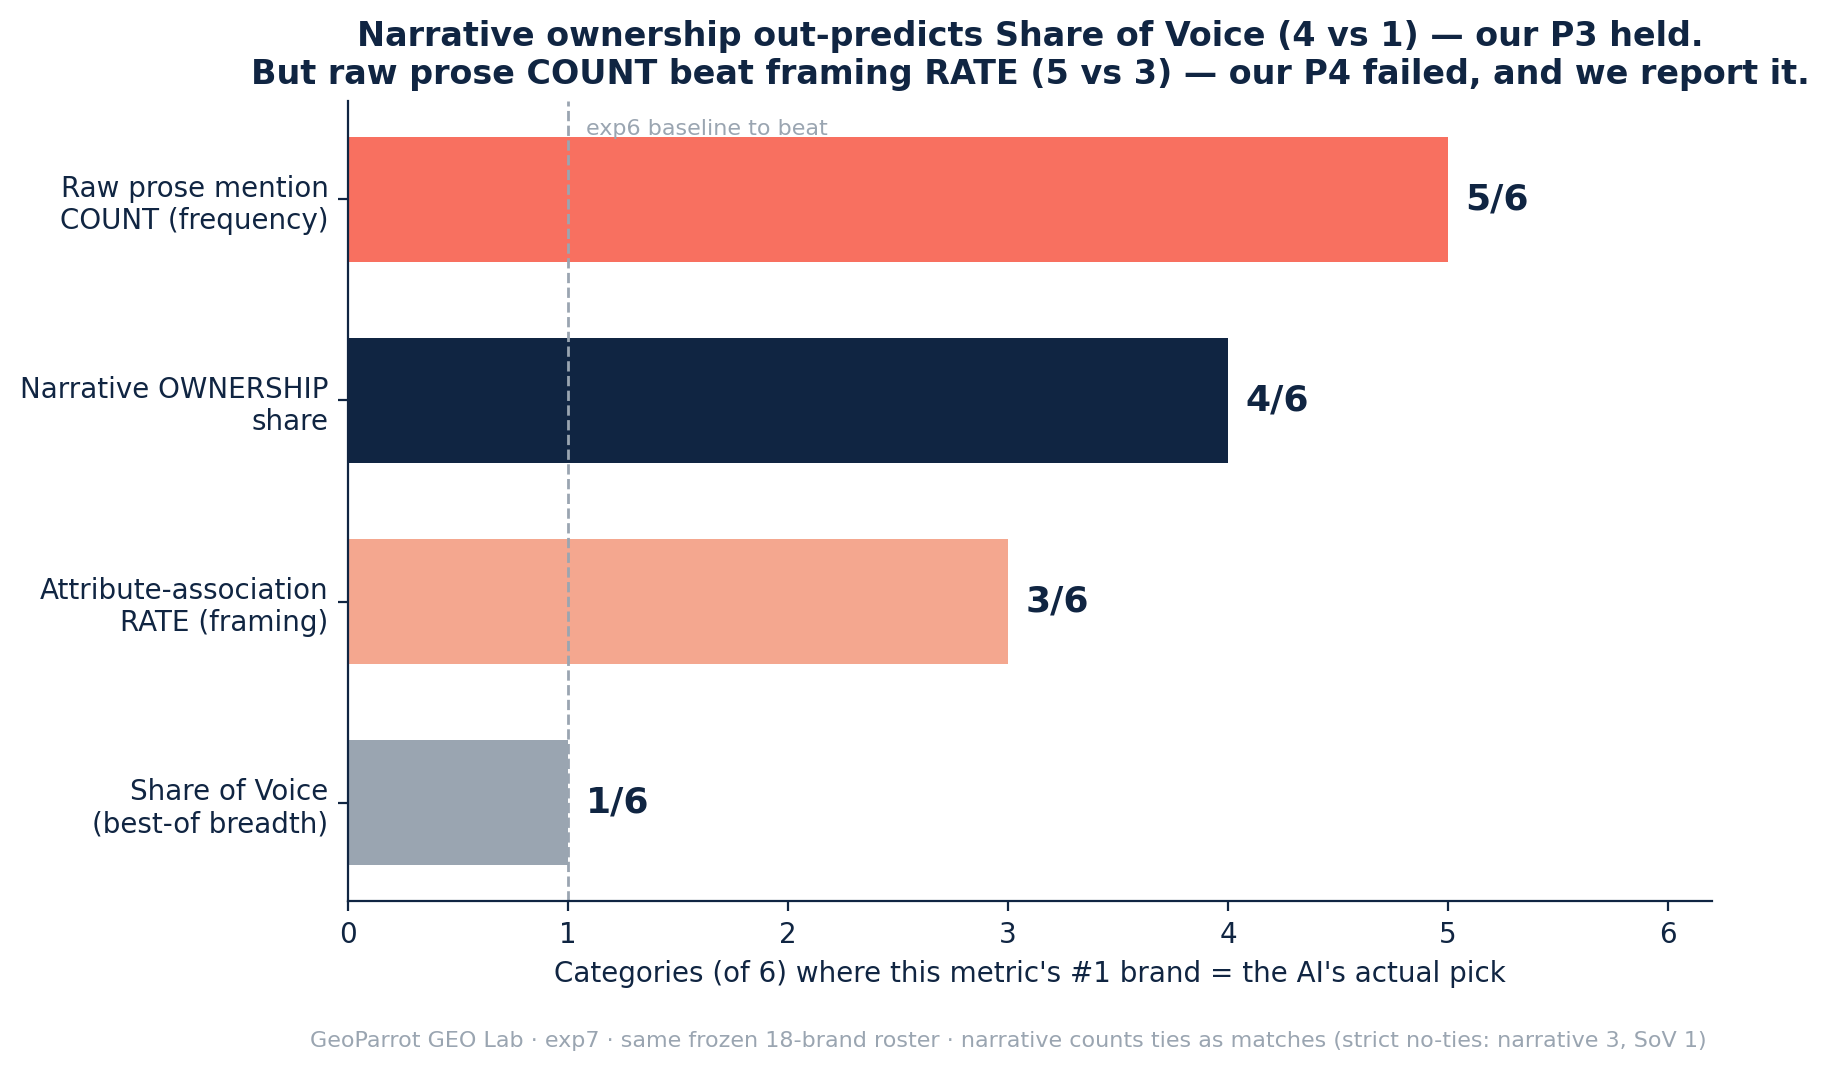
So the headline of the week holds: narrative ownership out-predicts Share of Voice, 4 to 1. If you were choosing one number to guess which brand an engine recommends, the share of a category’s defining-attribute language a brand owns beats the share of best-of lists it appears on, by a wide margin. That’s prediction 3 confirmed, and it’s the result that matters most for anyone deciding what to measure.
Can a brand own the narrative while losing Share of Voice? (Meet Mullvad.)
Prediction 2 said a Mullvad-type reversal would exist — a brand that is last on Share of Voice yet first on narrative ownership, and is the engines’ pick. It does, and it’s the same VPN case that opened the week. On Share of Voice, Mullvad appears on just 1 of 8 independent lists (12% breadth) while challenger Surfshark blankets all 8 (100%) and runner-up ExpressVPN 7 of 8 (88%). On narrative ownership of “privacy,” the ranking flips: Mullvad owns 43% of the category’s privacy-language, ahead of Surfshark’s 40% and ExpressVPN’s 17%.
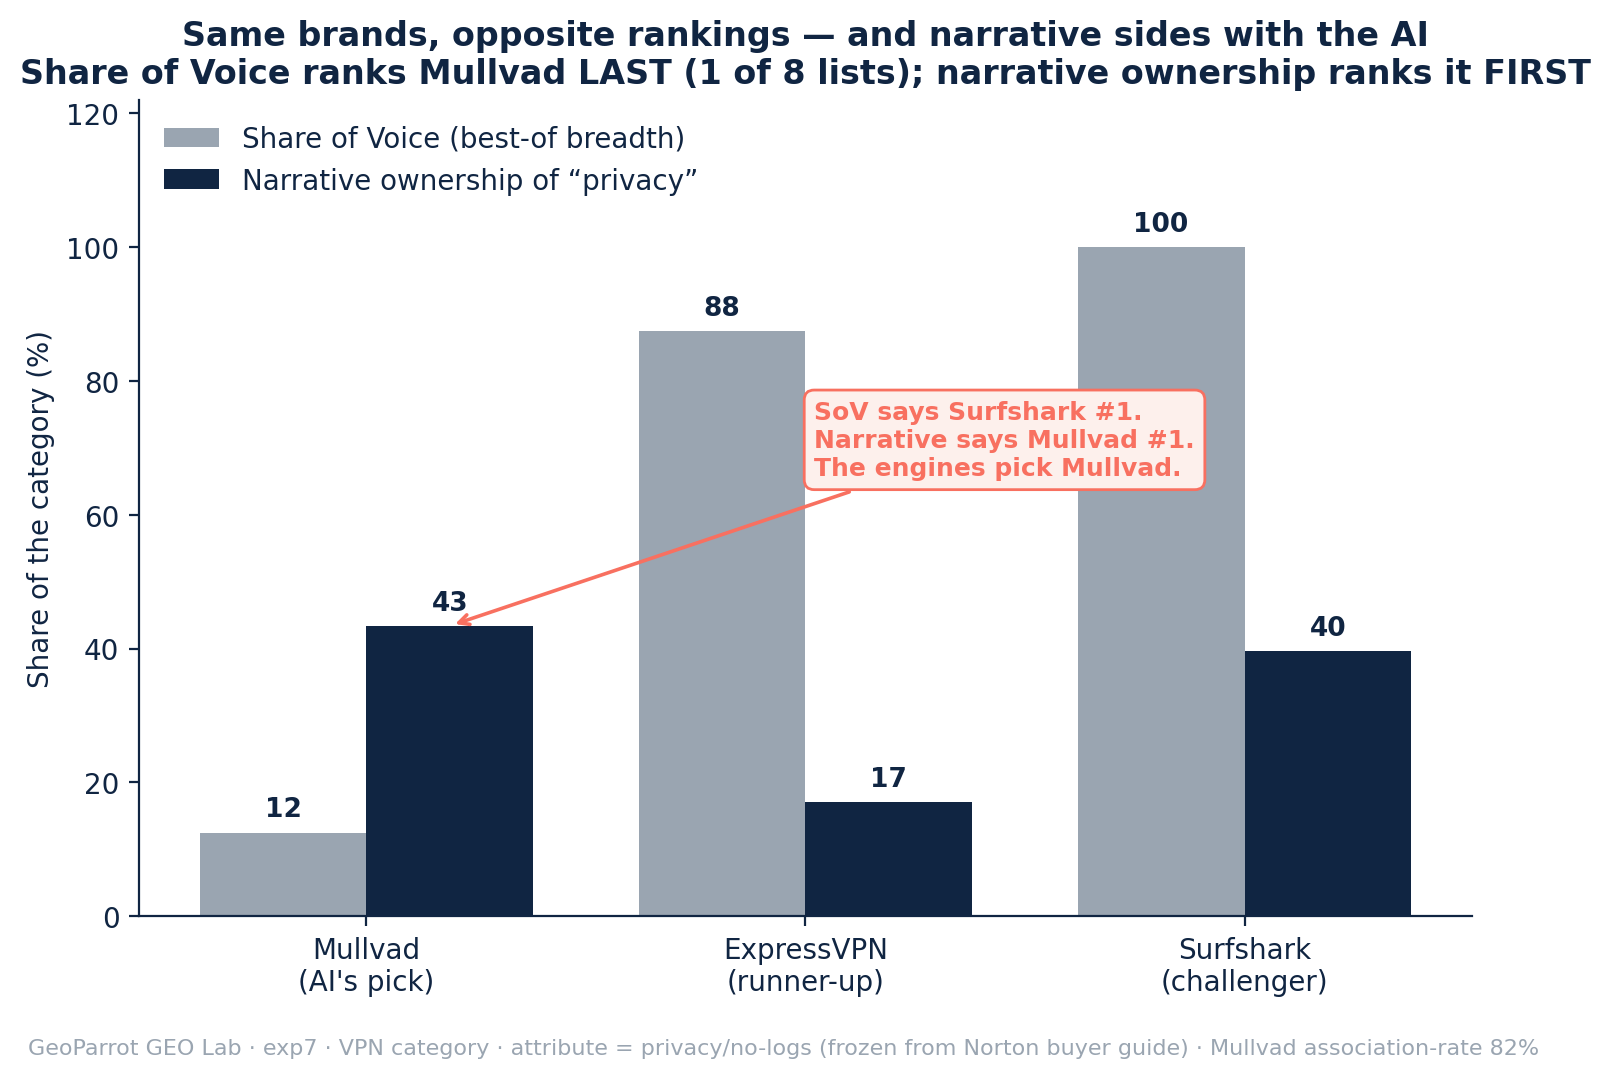
Share of Voice says Surfshark is the category leader. Narrative ownership says Mullvad. The engines pick Mullvad — the same #1 VPN across both — because Mullvad is the privacy reference point: 82% of its mentions in the corpus tie it directly to no-logs, RAM-only, anonymous-account language, versus a challenger like Surfshark whose mentions cluster around price and server count. The engines absorbed that prose, not the list count. This is exactly the disagreement case the method was built to catch, and it broke in the direction the hypothesis predicted.
The prediction that failed: does framing beat frequency? (No.)
Prediction 4 was our self-falsification guard, and it’s the one the data refused. The worry we locked in on Tuesday: if narrative-ownership share only out-predicts because it correlates with raw mention volume, then it’s just Share of Voice wearing a new hat. So we pre-committed to a tiebreaker — attribute-association rate (the volume-independent centrality measure: when a brand comes up, is it framed as the answer?) should predict the pick better than raw attribute-mention count. If rate wins, the mechanism is framing. If raw count wins, it’s frequency, and we said so up front.
Raw count won. Ranking each category by raw prose mention count, the #1 brand is the AI’s pick in 5 of 6 categories — better than our framing-rate measure (3 of 6) and better than ownership share itself (4 of 6). Only VPN breaks the raw-count pattern, and it breaks it because of Mullvad. So the honest reading is layered: narrative ownership genuinely out-predicts Share of Voice, but a chunk of its predictive power rides on how much independent prose talks about a brand, not purely on how it’s framed. Framing is doing real work in the reversal cases (it’s the only thing that explains Mullvad), but across the full set, prose volume is the stronger single signal.
There’s a crucial nuance that keeps Monday’s claim alive: the frequency that predicts here is prose mention count — how often independent editorial talks about a brand — not best-of breadth, the list-placement count Share-of-Voice tools actually optimize. Breadth still scored 1 of 6. So “counting” isn’t uniformly useless; counting the right thing (attribute-tied prose) is what works, and counting list placements is what doesn’t. Whether that makes narrative ownership a distinct metric or “prose Share of Voice with a centrality tiebreaker” is precisely the question Friday’s verdict has to rule on.
How did the four pre-registered predictions score?
We wrote these down before coding a single mention. Here’s the honest scorecard.
| Pre-registered prediction | Verdict | What the data said |
|---|---|---|
| 1. Picks out-own their runner-ups in ≥4 of 6 categories | ✅ Held | Exactly 4 of 6 (live chat, marketing automation, survey, VPN). Misses: help desk 44% vs 52%, accounting 40% vs 42% |
| 2. A Mullvad-type reversal exists (SoV-last but narrative-first, and it’s the pick) | ✅ Held | Mullvad: 1 of 8 lists (12% SoV) yet 43% narrative ownership of “privacy” — first in the category, and the AI’s #1 VPN |
| 3. Narrative ownership out-predicts Share of Voice (beat the 1-of-6 exp6 bar) | ✅ Held | Narrative #1 = the pick in 4 of 6 categories (3 of 6 strict, no ties) vs Share of Voice’s 1 of 6 |
| 4. Framing beats frequency (association rate predicts better than raw count) | ❌ Refuted | Raw prose count = the pick in 5 of 6; association rate only 3 of 6. Volume out-predicted framing — the guard fired |
Three of four held, and the one that failed is the one we most wanted to survive — it’s the difference between “narrative ownership is a genuinely new signal” and “it’s a smarter way of counting the same mentions.” We’re not going to soften that on Thursday to protect Monday’s framing. The metric works; why it works is not fully what we bet.
What are the honest limits here?
Coding prose is more subjective than counting lists, and the numbers show it. Specific caveats we won’t paper over:
- Inter-coder disagreement averaged 36%. Two independent passes classified each mention as attribute-linked or generic; they disagreed on roughly a third of calls, and on survey it was 67%. That’s a real cost the method warned about — treat the per-category percentages as directional, not exact, and read survey’s result with the most caution.
- Retrofitting the attribute is the fatal failure mode, and it’s the one you can’t fully verify from outside. We froze each attribute from a neutral “how to choose” guide before scoring and published every attribute with its source, so a reader can object “wrong attribute for accounting” and re-run — but the guardrail is a discipline, not a proof.
- Six categories, 18 brands, hand-coded. Strong patterns, not decimal precision. Prediction 1 landing exactly on its 4-of-6 threshold is a reminder of how thin the margins are.
- Correlational, not causal. Even where picks own more narrative, that ownership may be a byproduct of being the genuinely better tool, not a lever a challenger can pull. This week only tested whether it predicts. Friday takes up whether it’s actionable.
- Reused roster cuts both ways. Holding the exp6 roster fixed made the comparison apples-to-apples with Share of Voice, but any quirk in that 6-category draw rides along. We’d want a fresh category set before calling this a law.
What does this mean if you’re doing GEO?
Two practical takeaways survive the failed prediction. First, stop optimizing best-of breadth as your visibility metric — it predicted the engines’ pick in 1 of 6 categories, and your runner-ups already match you on it. Second, the thing that predicts is how much attribute-tied prose independent writers produce about you — not how many lists you’re on. Whether you call that “narrative ownership” or “prose mention volume,” the action is the same: become the brand independent editorial reaches for when it explains the thing your category is bought for, the way Mullvad owns “privacy.” Where our result adds a caution: don’t assume clever framing alone gets you there — volume of attribute-tied prose is doing more of the work than pure centrality, so the challenger’s job is to earn more independent writing that ties them to the defining attribute, not just a few perfectly-framed mentions. Friday we rule on Monday’s claim and turn this into a concrete playbook: given that prose volume beat framing, what should a challenger actually spend next quarter earning?
Frequently asked questions
Did narrative ownership out-predict Share of Voice?
Yes. Across 6 buyer-intent categories, the brand with the highest narrative ownership was the AI’s actual pick in 4 of 6 categories (3 of 6 if ties don’t count), versus Share of Voice’s best-of-breadth leader at just 1 of 6. Narrative ownership also separates the tiers cleanly — picks own 44% of their category’s defining-attribute language on average, runners-up 35%, challengers 22%.
Which prediction failed, and why does it matter?
We predicted that framing — attribute-association rate, a volume-independent centrality measure — would predict the pick better than raw mention frequency. It didn’t: raw prose mention count matched the pick in 5 of 6 categories, ahead of the framing rate’s 3 of 6. It matters because it means part of narrative ownership’s predictive power is still plain volume, not purely how a brand is framed — so it’s not a fully “new” signal, and Friday’s verdict has to address whether it’s distinct from a smarter Share of Voice.
How can Mullvad rank first on narrative but last on Share of Voice?
Share of Voice counts list placements — Mullvad is on just 1 of 8 VPN best-of lists. Narrative ownership counts attribute-language: 82% of Mullvad’s mentions tie it directly to privacy/no-logs, so it owns 43% of the category’s privacy-language, ahead of Surfshark (40%) and ExpressVPN (17%). The engines recommend Mullvad because they absorbed that privacy narrative, not the list count — which is exactly why narrative ownership predicts the pick where Share of Voice doesn’t.
How reliable is hand-coded “narrative” scoring?
Less reliable than counting lists, and we report the cost: two independent coders disagreed on about 36% of mention classifications on average (67% on survey, the worst category). We mitigate with a rubric frozen before scoring, attributes fixed from neutral sources, and full publication of the coded roster — but you should read every percentage as “the pattern is strong,” not “this figure to the decimal.”
Sources & method:
- GeoParrot GEO Lab exp7 — 18 brands across 6 buyer-intent categories, re-scored for narrative ownership on the same frozen independent corpus (no engine re-query). Labels frozen from exp5’s two-engine consensus and the exp6 roster; full pre-registered method, rubric and predictions in Tuesday’s post.
- This week’s arc — Monday: is Share of Voice the wrong AI-visibility metric? · Tuesday: the pre-registered scoring method · Friday: the verdict + challenger playbook (coming).
- Related GEO Lab work — no single counting signal separates the AI consensus pick, the consensus pick is real and can’t be self-manufactured, and engines cite different sources but converge on the same recommendation — evidence the shared signal is language, not link count.
- Context — Best GEO Tools 2026, the Share-of-Voice-centric tooling landscape this experiment stress-tests.
Leave a Reply