
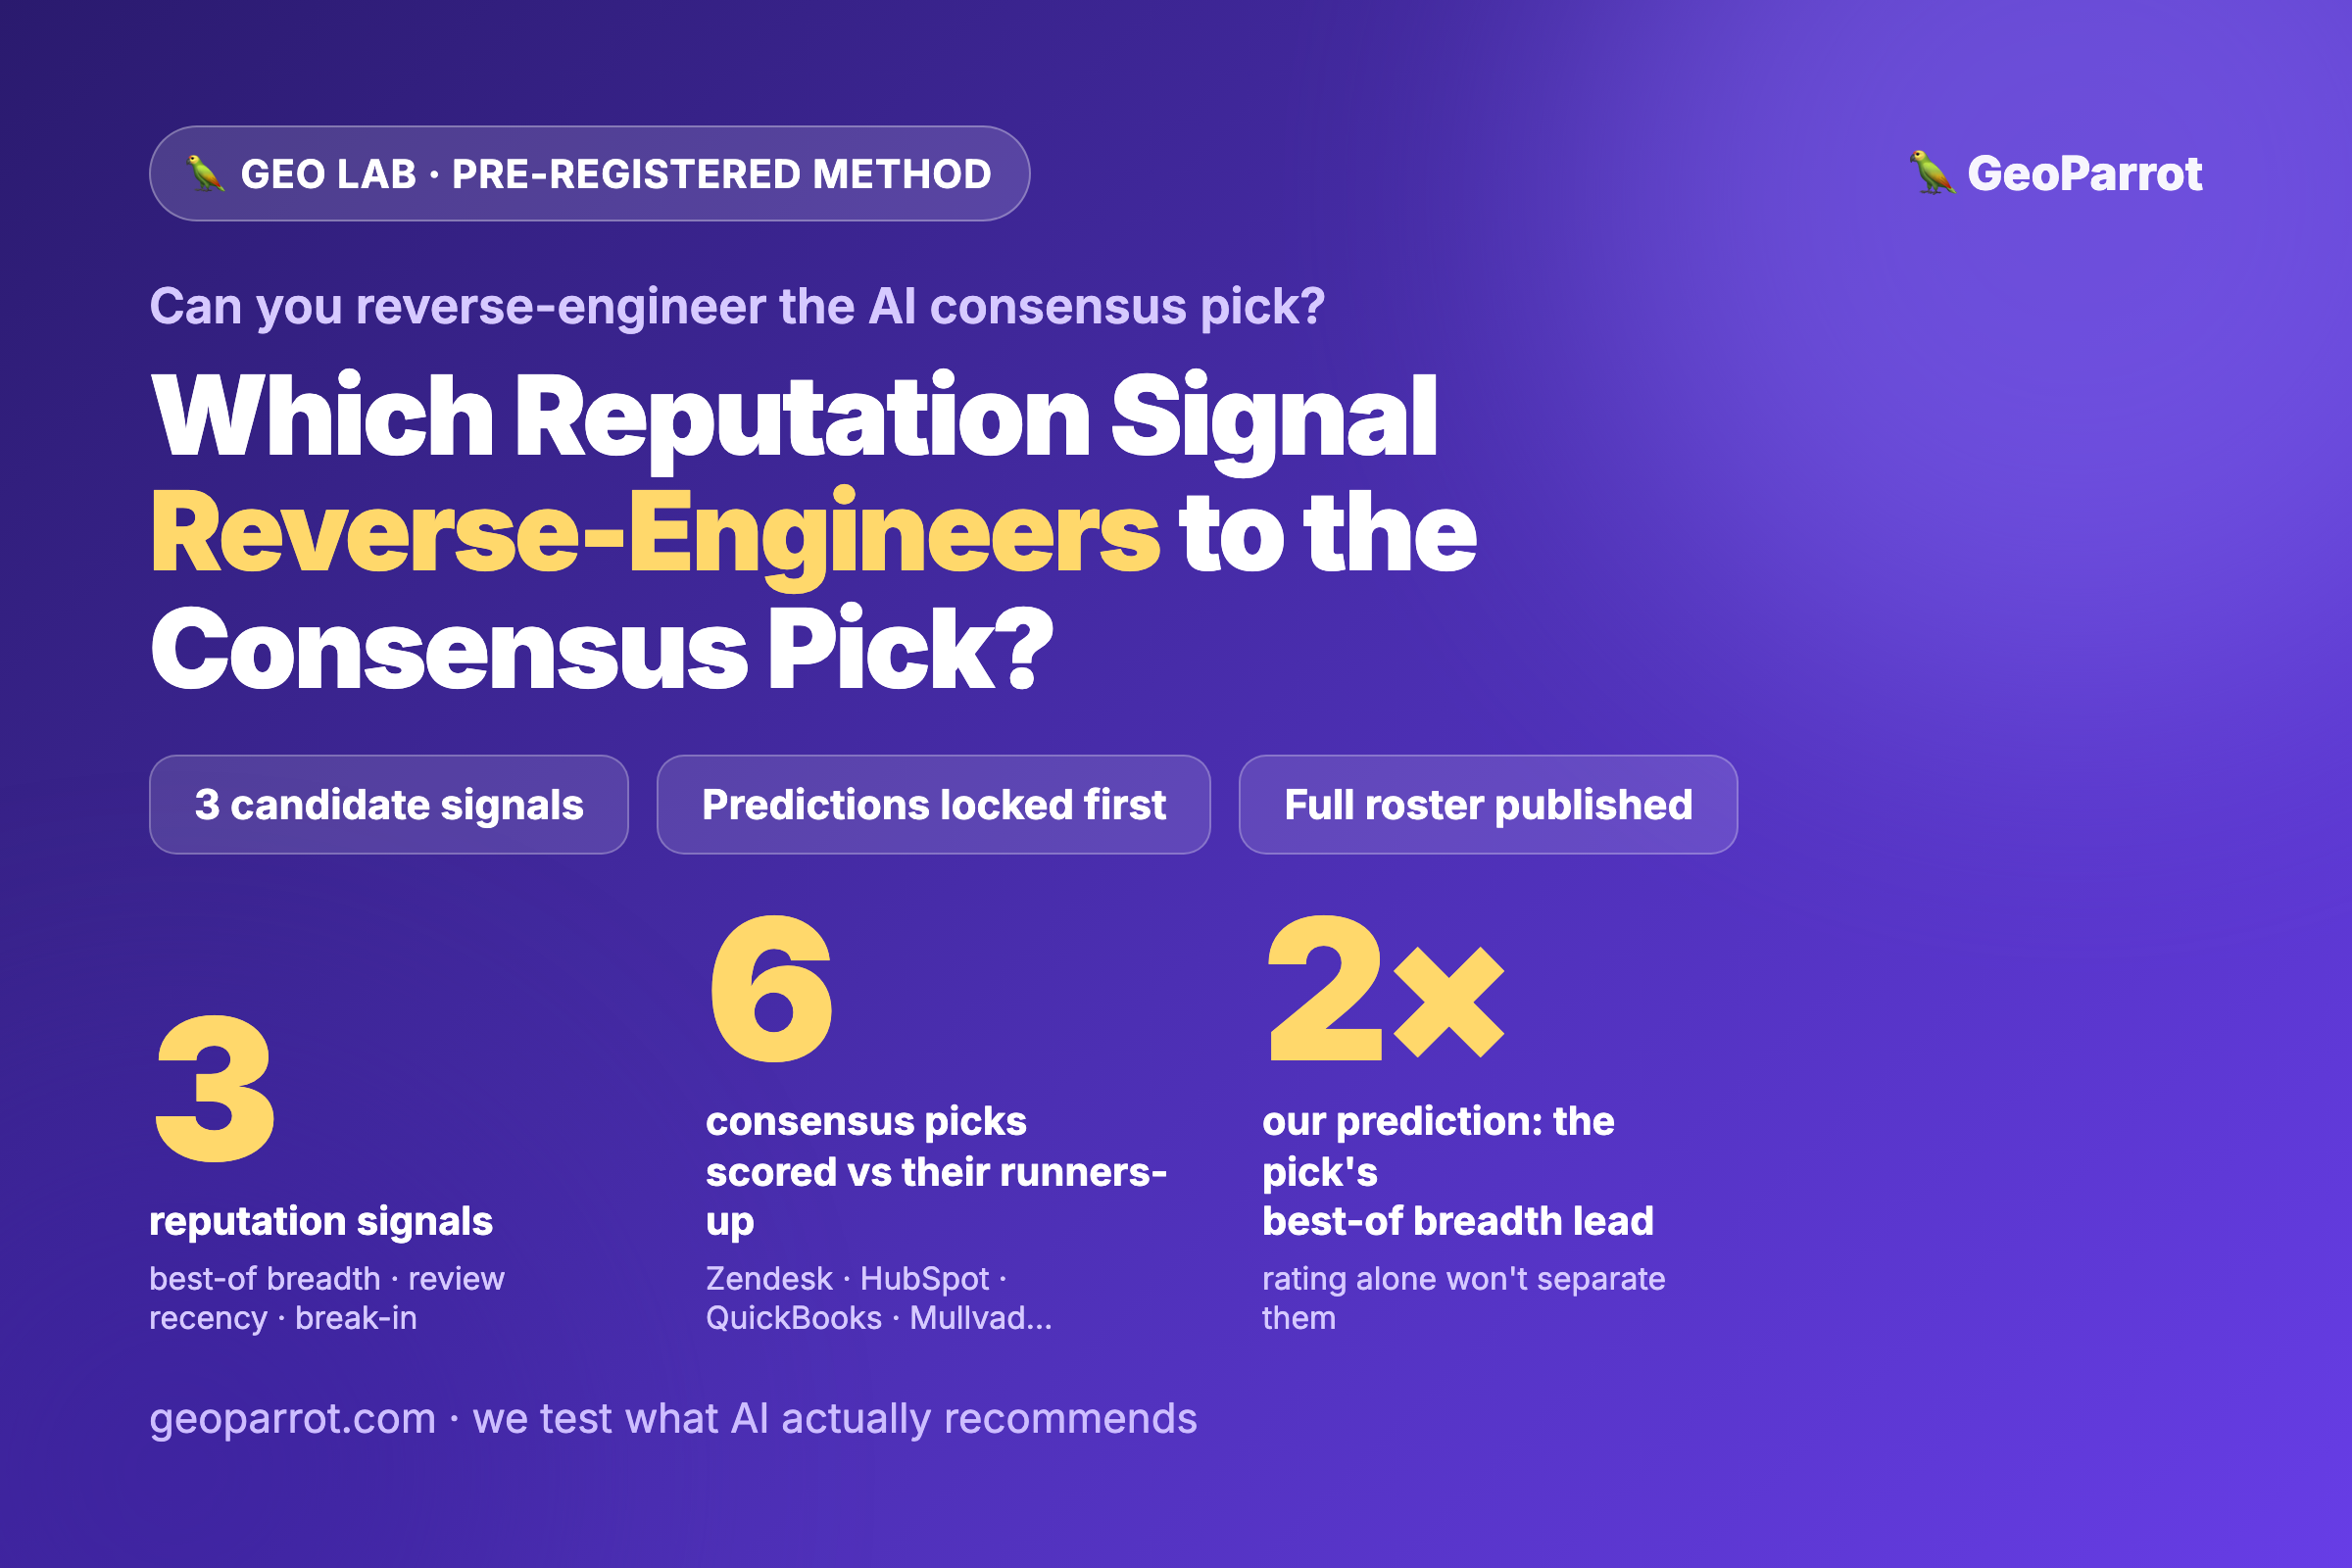
Quick answer: Monday we established two facts about the AI “consensus” pick: it’s real — across 12 buyer-intent categories, two engines’ top recommendation sets overlapped 100% of the time and named the identical #1 in 6 of 12 — and it can’t be self-manufactured (self-citing vendors won the pick 0 of 2 times). The open question is which measurable reputation signals actually separate a consensus pick from an equally-good runner-up. Our pre-registered method scores three candidate signals against a frozen roster of the consensus picks and their same-category runners-up: (1) third-party best-of breadth — how many independent lists name the brand, and whether there’s a breadth floor below which no brand becomes the pick; (2) review recency and density — whether it’s the star rating, the review volume, or the freshness that separates the pick from the runner-up; and (3) challenger break-in — whether any brand sits in the consensus set without already clearing the third-party floor. We’ve locked four predictions before measuring a single brand. This is the method, published before the numbers, so you can hold us to it.
Yesterday’s fact-check opened this week’s question: a brand becomes the AI consensus pick when independent third parties converge on it — and you can’t crown yourself. That tells us where the signal lives (off your own site) but not which signal decides it. Today, before we score a single brand, here’s exactly how we’ll find out — with the same pre-registration discipline we used for our Reddit causation method and our cross-engine overlap method.
What question are we actually answering?
One testable claim, stated plainly:
Hypothesis (H1): The AI consensus pick is separated from an equally-capable runner-up by third-party reputation breadth more than by any signal a brand controls. Consensus picks appear on markedly more independent best-of lists than their same-category runners-up, every consensus pick clears a breadth floor no runner-up crosses without also being a pick, and star rating alone does not separate the two (both cluster high). Reputation is reverse-engineerable, but the dominant lever is earned breadth, not rating or self-published volume.
Null hypothesis (H0): Consensus picks and runners-up look the same on every measurable third-party signal — breadth, rating, recency — and the pick is essentially a coin flip among strong brands, unpredictable from reputation data. If H0 holds, “the consensus pick” isn’t reverse-engineerable and the honest advice is that you can’t target it.
If H1 holds, GEO for a challenger becomes a concrete checklist: find the independent lists your category’s picks sit on, and earn your way onto enough of them to clear the floor. If H0 holds, consensus is luck and the only honest counsel is patience. The method below is built to tell those two worlds apart — and to name which signal, if any, does the separating.
What counts as a “reputation signal” — and how do we measure each?
This is the whole experiment, so we freeze the definitions before we score anything. For every brand on our roster we measure three signals, each on a rubric locked before collection:
| Signal | Definition (frozen before collection) | How we measure it |
|---|---|---|
| Third-party best-of breadth | How many independent “best [category]” / comparison pages name the brand — the TechRadar / PCMag / G2 / Capterra-class domains engines actually reach for, never the brand’s own site | A frozen set of ~10 independent lists per category; we record whether each names the brand and where (top-3 vs merely present) → a breadth count and a “named prominently” count |
| Review recency & density | The brand’s review footprint on major platforms — the rating, the volume, and the freshness of recent reviews — treated as three separate sub-signals, not one number | From G2 / Capterra / Trustpilot: average star rating, total review count, and share of reviews dated within the last ~6 months, each recorded per brand |
| Challenger break-in | Whether a brand is inside the consensus set despite not yet clearing the third-party breadth floor — the test of whether the moat can be jumped by anything other than earned breadth | We flag any consensus pick whose breadth/review signals are low, and any high-breadth brand that is not a pick, and read the mismatches |
The key move is that these signals are independent axes. A brand can have a stellar 4.7-star rating but sit on only two independent lists (high rating, low breadth), or blanket every list at a mediocre 4.1 (high breadth, mid rating). Separating the axes is the only way to say which one tracks the consensus pick — instead of asserting “reputation matters” and waving at all of it at once.
What roster are we scoring — and why reuse our labeled picks?
The outcome we’re predicting is already measured. In our self-ranking experiment (exp5) we ran 12 buyer-intent “best [category]” queries across two engines and scored every recommendation, which handed us a clean, pre-existing label for each brand:
- Consensus pick — named the identical #1 by both engines. Six categories qualified: help desk (Zendesk), live chat (LiveChat), marketing automation (HubSpot), survey (SurveyMonkey), accounting (QuickBooks), VPN (Mullvad).
- Runner-up — appeared in an engine’s shortlist for the same category but was not the shared #1 (e.g., Freshdesk vs Zendesk, ExpressVPN vs Mullvad).
- Challenger — a credible brand in the category that the engines named rarely or never.
Reusing exp5’s labels — rather than re-running engines this week — is deliberate, and it’s the honest choice for two reasons. First, the label is the hard part and it’s already frozen: we’re not tempted to re-collect until the recommendations flatter a signal we like. Second, it keeps this week’s numbers comparable to the consensus we already published. What we collect fresh is the signal side: for each brand on the roster, we hand-measure the three reputation signals from independent sources. So the experiment is a separation test — hold the outcome fixed, measure the signals, and ask which signal splits picks from runners-up. The roster (every brand, its label, and its three signal scores) ships as a downloadable table with Thursday’s results, the same reproducibility standard as our cross-engine data.
What are the three parts of the test?
| Part | What it measures | What an “H1 is right” result looks like |
|---|---|---|
| 1 · Best-of breadth split | Whether consensus picks sit on more independent lists than same-category runners-up | Picks appear on markedly more independent lists; a breadth floor exists that runners-up don’t cross |
| 2 · Review signal decomposition | Which of rating / volume / recency separates picks from runners-up | Rating is similar for both; volume and recency separate more — rating is a floor, not the lever |
| 3 · Break-in / mismatch read | Whether any brand is a pick without the breadth, or has the breadth without being a pick | Almost no pick lacks the breadth floor; the moat is earned breadth, slow to move |
Part 1 — The best-of breadth split
For each category we freeze a set of ~10 independent best-of / comparison pages — the review-media and directory domains engines demonstrably prefer, explicitly excluding any vendor’s own site. For every brand on the roster we record two counts: breadth (how many of those lists name it at all) and prominence (how many name it in the top three). Then we compare the distribution for consensus picks against same-category runners-up. The hypothesis is a visible gap — picks blanket the independent lists, runners-up appear on a subset — and, more usefully, a floor: a breadth level below which no brand is ever the consensus pick. If picks and runners-up have indistinguishable breadth, this signal is dead and H1 loses its main claim.
Part 2 — The review signal decomposition
“Review-rich brands get recommended” is true but too blunt to act on — it bundles three different things. So we split them. For each brand we pull, from the major review platforms, the average rating, the total review count, and the recency (share of reviews from roughly the last six months). Then we ask which of the three separates picks from runners-up. Our expectation, stated up front: rating barely separates them — both a Zendesk and a Freshdesk sit around 4.3–4.5 stars, so a good rating is table stakes, not a differentiator — while volume and recency carry more signal, because a deep, still-active review base is exactly the kind of ongoing third-party attention that keeps a brand in the engines’ training and retrieval. If rating turns out to separate them cleanly, we were wrong, and we’ll say so.
Part 3 — The break-in / mismatch read
This is the part that answers the challenger’s real question: can you jump the moat, or only earn your way over it? Rather than pretend we can run a quarter-long controlled intervention, we read the mismatches in the roster honestly. Two failure modes would falsify the moat story: a consensus pick with low breadth and thin reviews (proof the pick can be won without the earned signals), or a high-breadth, review-rich brand that is not a pick (proof breadth is necessary but nowhere near sufficient). We catalogue every such mismatch and let it temper the verdict. Where a challenger visibly rose or fell, we reconstruct the rough timeline from the review-count and list-appearance trail — a lookback proxy, clearly labeled as correlational, never sold as a controlled test of “break-in speed.”
How do we score without fooling ourselves?
| Risk | How we control for it |
|---|---|
| Cherry-picking flattering lists | The ~10 independent lists per category are chosen and frozen before we score any brand, and published with the results so anyone can re-count |
| Correlation mistaken for cause | Stated plainly: this is a separation test on a fixed outcome, not an intervention. We can show a signal tracks the pick; we can’t prove it causes it, and we won’t claim to |
| Motivated reading of “prominent” | Top-3 placement is a mechanical rule, scored twice; ambiguous list orderings logged with a reason rather than forced |
| Outcome label inherits engine gaps | The consensus labels come from two engines (ChatGPT and Google were throttled in exp5); we carry that caveat forward and never imply four-engine certainty |
| Small, hand-run sample | Six labeled categories, hand-measured signals — we report this as “the pattern is strong,” not “these figures to the decimal,” and publish the full roster to disagree with |
| Self-published signals sneaking in | The breadth rubric excludes any vendor-owned page by definition, so a brand can’t inflate its own breadth — echoing why self-ranking failed |
Our predictions — locked in before we measure a single brand
Pre-registration is what separates an experiment from a story told afterward. On the record, before collection:
- Breadth is the dominant separator. Consensus picks appear on at least 2× the independent best-of lists that their same-category runners-up do, and every consensus pick clears a breadth floor — appearing on a majority of its category’s independent lists — that at least one strong runner-up fails to cross.
- Rating alone doesn’t separate; volume and recency do. Average star rating is similar for picks and runners-up (both cluster near 4.2–4.5★), so rating is a floor you must clear, not the lever. Review volume and recency show a wider gap between the two groups than rating does.
- Self-controlled signals don’t predict consensus. A brand’s own best-of publishing and self-mentions have near-zero association with being the pick — consistent with the 4.2% of #1 picks that traced to the brand’s own domain. Earned breadth predicts; owned volume doesn’t.
- The moat is breadth-gated, not sprint-able. No brand sits in the consensus set without already clearing the third-party breadth floor — there is no “content-sprint” shortcut into the pick. The honest challenger lever is accumulating independent placements over time, and Part 3 will surface no counterexample of a low-breadth pick.
If the data contradicts any of these, we’ll say so on Friday. That’s the entire point of writing them down where you can see them.
Next at GEO Lab: we score the full roster midweek and publish the results Thursday — every number against these four predictions, with charts — then deliver Friday’s verdict and a reputation-signal playbook: given which signal actually separates the pick, what should a challenger spend the next quarter earning? Start with Monday’s fact-check →
FAQ
What are you actually testing this week?
Not whether a consensus pick exists — Monday’s data confirmed it (two engines overlapped in all 12 categories, same #1 in 6). This week tests which reputation signal separates a consensus pick from an equally-good runner-up: third-party best-of breadth, review recency and density, or neither. We score three candidate signals against a fixed roster of picks vs runners-up.
Why reuse last week’s recommendations instead of re-running the engines?
Because the outcome — who the consensus pick is — is the hard part, and it’s already frozen from exp5. Re-collecting it now would tempt us to keep pulling until the recommendations flattered a signal we like. So we hold the outcome fixed and collect fresh signal data (breadth, reviews) for each brand, then ask which signal splits the two groups.
Isn’t measuring “best-of breadth” by hand subjective?
Somewhat — which is why the ~10 independent lists per category are chosen and frozen before any brand is scored, top-3 prominence is a mechanical rule scored twice, and the full roster of lists and per-brand counts ships with the results so you can re-count and disagree with any specific call.
Can this prove a signal causes the consensus pick?
No, and we won’t claim it. This is a separation test on a fixed outcome: it can show that a signal reliably tracks the pick, which is what you need to reverse-engineer a target. Proving causation would require moving a real brand’s breadth and re-measuring — a quarter-long intervention we flag as future work, not this week’s claim.
When do we get the answer?
The results and charts land Thursday, with the verdict and a challenger reputation playbook Friday.
Sources
- GEO Lab — How Does a Brand Become the AI “Consensus” Pick? The Reputation Signals — and What You Can’t Fake (this week’s fact-check and the candidate signals)
- GEO Lab — Can You Self-Rank Your Way Into an AI Recommendation? What 24 Answers Show (the exp5 consensus labels and the 4.2% self-cited figure this method reuses)
- GEO Lab — You Can’t Self-Rank Into an AI Recommendation — The Verdict (why owned signals don’t manufacture the pick)
- GEO Lab — Do 15 Domains Control 68% of AI Citations? Our Data Says 23% (the independent best-of domains our breadth set draws from)
- GEO Lab — AI Engines Cite Different Sources — But Do They Agree? (the 0.5% source overlap and our reproducibility standard)
- GEO Lab — Does a Reddit Mention Actually Cause an AI Citation? Our Pre-Registered Method and How We’re Testing Whether One GEO Strategy Works Across AI Engines (our pre-registration discipline)
Leave a Reply