
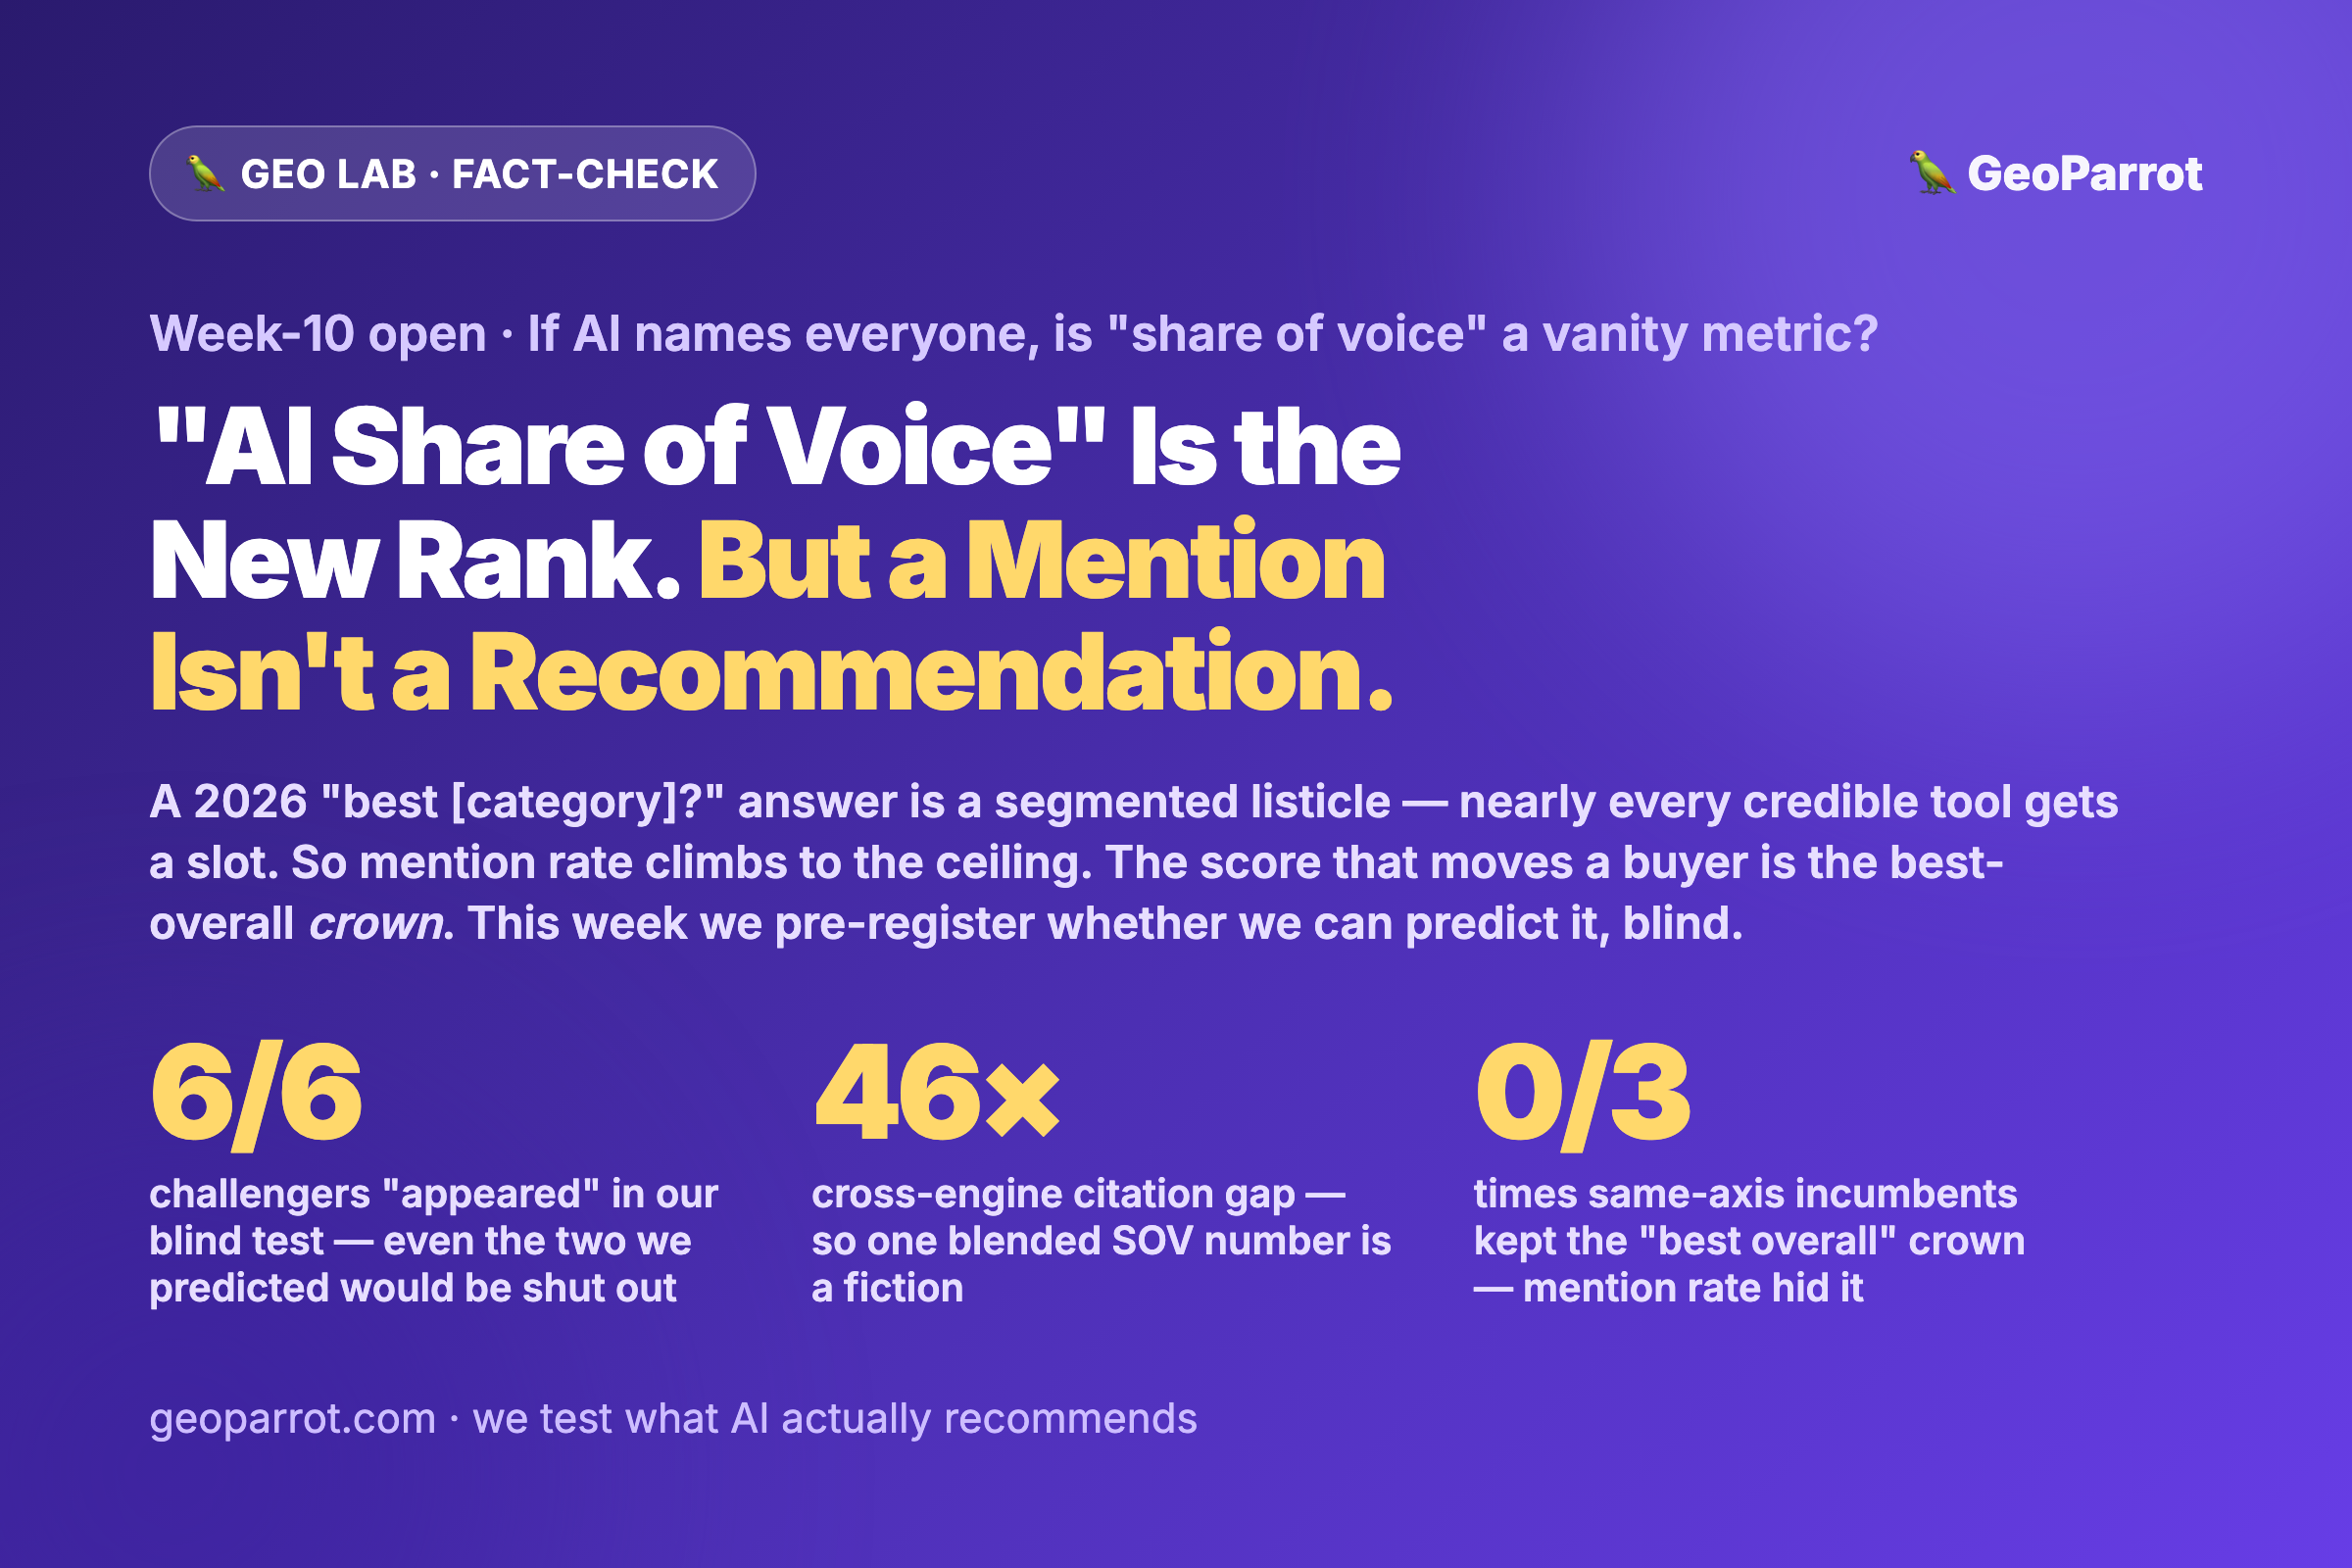
Quick answer: Half true. It’s fair to say how often an AI names your brand has replaced blue-link rank as the visibility signal — that part of the “AI Share of Voice” pitch is real, and a fast-growing tool category now sells it with tidy benchmark tiers (below ~8% is a “citation gap,” 15–25% “competitive,” above 40% “category-dominant”). But there’s a trap the dashboards gloss over: a neutral “best [category] in 2026?” query returns a segmented listicle — “best for beginners,” “best free,” “best for teams” — so nearly every credible tool earns a “best for ___” slot. When we ran a blind test across six fresh categories last week, all six challengers “appeared” in all three engines — including the two we had predicted would be shut out. A metric almost everyone can max out doesn’t separate winners from also-rans; that is the textbook definition of a vanity metric. The score that actually moves a buyer is sharper: who did the engine crown “best overall”? This is Monday’s fact-check, and it opens this week’s question — can we predict the crown, before we look, on categories we’ve never tested?
This week’s GEO Lab arc is one question, run in the open: is “AI visibility” — mention rate, share of voice — the metric that matters, or a vanity number now that the answer names almost everyone, with the real prize being the best-overall crown? It’s a direct sequel to last week, when our own geometry rule failed its blind test at 4 of 6 — not because the idea was wrong, but because we’d scored it on “did the challenger appear?” and in 2026 almost everyone appears. The wreckage pointed straight at a better yardstick. Today we make the case for it; the rest of the week puts it at risk.
What is “AI Share of Voice,” and why is everyone suddenly selling it?
The pitch is clean and mostly correct. As AI answers replace the ten blue links, the thing worth measuring shifts from “what position do I rank?” to “how often does the engine name me, and against whom?” Vendors have formalized this into two metrics:
- Mention rate — absolute visibility. Divide the responses that mention your brand by total responses. If 38 of 250 answers name you, that’s a 15.2% mention rate.
- Share of voice (SOV) — competitive visibility. Divide your mentions by the total mentions across you plus your named competitors. 38 of 120 total is a 31.7% SOV.
Around these, a benchmark language has hardened fast: for B2B software, below ~8% signals a “citation gap,” 8–15% is “emerging,” 15–25% “competitive,” above 25% “strong,” and above 40% “category-dominant,” with category leaders in saturated markets told to hold 35–40% SOV on best-of prompts. It’s a real market — U.S. GEO tooling is projected around $365 million in 2026 at a ~43% growth rate — so the incentive to make the number look decisive is enormous. And the underlying instinct is right: in the AI-answer era, visibility is engine-mediated, not position-mediated. The question is whether the number they hand you actually measures winning.
Is mention rate becoming a vanity metric?
Here’s the uncomfortable part. A vanity metric is one that goes up easily, looks impressive, and doesn’t correlate with the outcome you care about. Mention rate is drifting into exactly that zone — for a structural reason. When you ask a 2026 engine “best CRM in 2026?” it rarely returns a single ranked list. It returns a segmented one: best overall, best for small teams, best free option, best for enterprise, best for a specific workflow. Every one of those slots is a “mention.” So the bar for “getting mentioned” has collapsed to roughly “be a credible tool with a docs page and a few reviews.”
We didn’t theorize this — we measured it. In last week’s pre-registered blind test we queried six brand-new categories and predicted that two challengers (ActiveCampaign in email, Pipedrive in CRM) would be held out because their story was just a “better version” of the incumbent’s own axis. They weren’t. All six challengers appeared in all three engines — 18 of 18 engine-observations. On the appearance yardstick, our carefully reasoned prediction and a coin flip would have scored the same, because the yardstick itself can’t fail anyone. When a metric can’t produce a loser, its high scores mean almost nothing.
There’s a second, quieter reason to distrust a single SOV figure: it’s wildly engine-dependent. Independent 2026 benchmarks put brand-citation rates at roughly 0.59% on ChatGPT versus 13.05% on Perplexity — a 46× spread for the same questions. A “22% share of voice” that averages those is a fiction; it describes no engine your buyer actually uses. We’ve seen the same fragmentation in our own work: engines cite almost entirely different source URLs and still land on different picks.
What’s the metric that actually moves a buyer?
Being on a long “best for ___” menu is not the same as being the recommendation. When a person asks an AI for the best tool and takes the answer at face value, the decision-shaping signal is narrow: which brand got named “best overall,” first, or “if you only pick one.” That’s the crown. And the crown behaves very differently from mention rate — it’s scarce, so it can actually sort.
Re-scoring the same blind data at crown resolution, the picture sharpened immediately. Both same-axis incumbents that we’d expected to dominate lost the crown: Mailchimp kept “best overall” in 0 of 3 email answers (demoted to “best for beginners” while HubSpot and Klaviyo took the top), and Salesforce kept it in 0 of 3 CRM answers (all three crowned HubSpot). Meanwhile the challengers on a genuinely distinct axis — Obsidian’s local-first notes, Brave’s privacy — took or shared the top slot. Same brands, same answers; only the yardstick changed, and suddenly there were winners and losers again. That is what a decision-relevant metric looks like.
This also lines up with a pivot the smarter vendors are already making — from raw share of voice toward “revenue share of voice,” weighting mentions by whether they’re the kind that actually drive a choice. The instinct is correct; the crown is the cleanest observable version of it.
Doesn’t share of voice already capture this?
Not as it’s usually computed. Standard SOV counts every mention equally: a throwaway “best for hobbyists” slot adds the same +1 as being crowned the single best tool in the category. So two brands can post identical SOV while one owns the crown across the category and the other is permanently filed under a niche caveat. SOV tells you how much airtime you get; it doesn’t tell you whether the airtime recommends you. That distinction is the whole game, and it’s exactly the one we’ve been chasing all summer — from who owns the defining narrative of a category to whether you can earn that ownership at all. Mention rate measures presence. The crown measures preference. Only one of them is what a buyer acts on.
So how should you measure AI visibility instead?
Keep mention rate as a floor check — if you’re not even appearing, fix that first. But don’t mistake the floor for the finish line. A more honest scorecard:
- Track crown rate, not just mention rate. For your core “best [category]” prompts, count how often you’re the best-overall / first / “if you pick one” answer — not merely present somewhere in the segmented list.
- Report per engine, never averaged. Given the 46× cross-engine gap, one blended number hides which engine you’re losing. Score ChatGPT, Perplexity, and Google AI Mode separately.
- Watch which slot you own. “Best for beginners” is a ceiling; “best overall” is the goal. If you’re always the caveat, that’s a positioning problem, not a coverage problem.
- Tie it to a testable lever. Our working hypothesis is that the crown follows a distinct narrative axis, not raw volume — which is precisely what we’re about to test, out-of-sample, this week.
What are we testing this week?
The rest of the arc turns this fact-check into an experiment, pre-registered and run in the open:
- Tuesday — pre-register the crown test. Pick fresh categories, code each one’s narrative geometry blind, and write down — publicly, before any query — which brand we predict will take the crown, with the pass/fail line fixed in advance.
- Wednesday — collect blind. Query the engines and record the actual best-overall pick per category, without touching the pre-registered codes.
- Thursday — results. Score prediction against outcome at crown resolution, with charts.
- Friday — verdict. If a distinct-axis rule can call the crown out-of-sample, it earns the word “rule.” If it can’t, we say plainly that last week’s surviving signal was appearance-level noise after all — publicly, in the same place we claimed it.
Either way you get what most GEO content never gives you: a visibility metric put at risk before the data came in. If you only remember one thing from Monday, make it this — a mention is not a recommendation, and only one of the two is worth optimizing for. You can see our full first-party scorecard in the 2026 GEO Benchmark.
Frequently asked questions
Is AI Share of Voice a useless metric?
No — it’s a useful floor check. If your mention rate is near zero, you’re invisible and that’s the first thing to fix. The caution is narrow: because 2026 “best X” answers are segmented listicles that name nearly every credible tool, a high mention rate no longer signals that you’re winning. Pair it with crown rate to see whether you’re recommended, not just present.
What’s the difference between mention rate and share of voice?
Mention rate is absolute — the share of AI answers that name you at all. Share of voice is competitive — your mentions as a percentage of all brand mentions across you and your named rivals. Both count a “best for beginners” slot the same as a “best overall” crown, which is exactly why neither alone tells you if the AI actually recommends you.
What is the “best-overall crown”?
The single decision-shaping pick in an AI answer — the brand named best overall, first, or “if you only choose one.” Unlike mention rate, it’s scarce, so it can sort winners from also-rans. In our blind data, two incumbents kept a high mention rate but lost the crown 0 of 3.
Why not just trust the benchmark tiers vendors publish?
The tiers (8% gap, 15–25% competitive, 40%+ dominant) describe mention/SOV, which is inflating toward the ceiling as answers segment. They also usually blend engines despite a ~46× cross-engine citation gap. Use them as rough context, then measure crown rate per engine for your own category.
How can I apply this today?
Run your top three “best [your category]” prompts on ChatGPT, Perplexity, and Google AI Mode. Record two numbers per engine: did you appear, and were you the best-overall pick. If you appear everywhere but never take the crown, your problem is positioning — owning a distinct axis — not coverage.
Sources
- Explorium — AI Share of Voice: The GEO Metric That Replaces SEO Rank in 2026 (SOV as the successor to rank; benchmark tiers).
- LLM Pulse — Share of Voice in AI Search: How to Calculate It in 2026 (mention rate vs SOV formulas and worked examples).
- AuthorityTech / Attrifast — AI Share of Voice 2026 (B2B SOV benchmarks; the pivot toward revenue share of voice).
- Averi.ai — ChatGPT vs Perplexity vs Google AI Mode: B2B SaaS Citation Benchmarks (2026) (0.59% vs 13.05% brand-citation rates; ~46× cross-engine gap).
- GeoParrot GEO Lab first-party data — blind test results (all six challengers appeared), week-9 verdict, 2026 GEO Benchmark.
Leave a Reply