
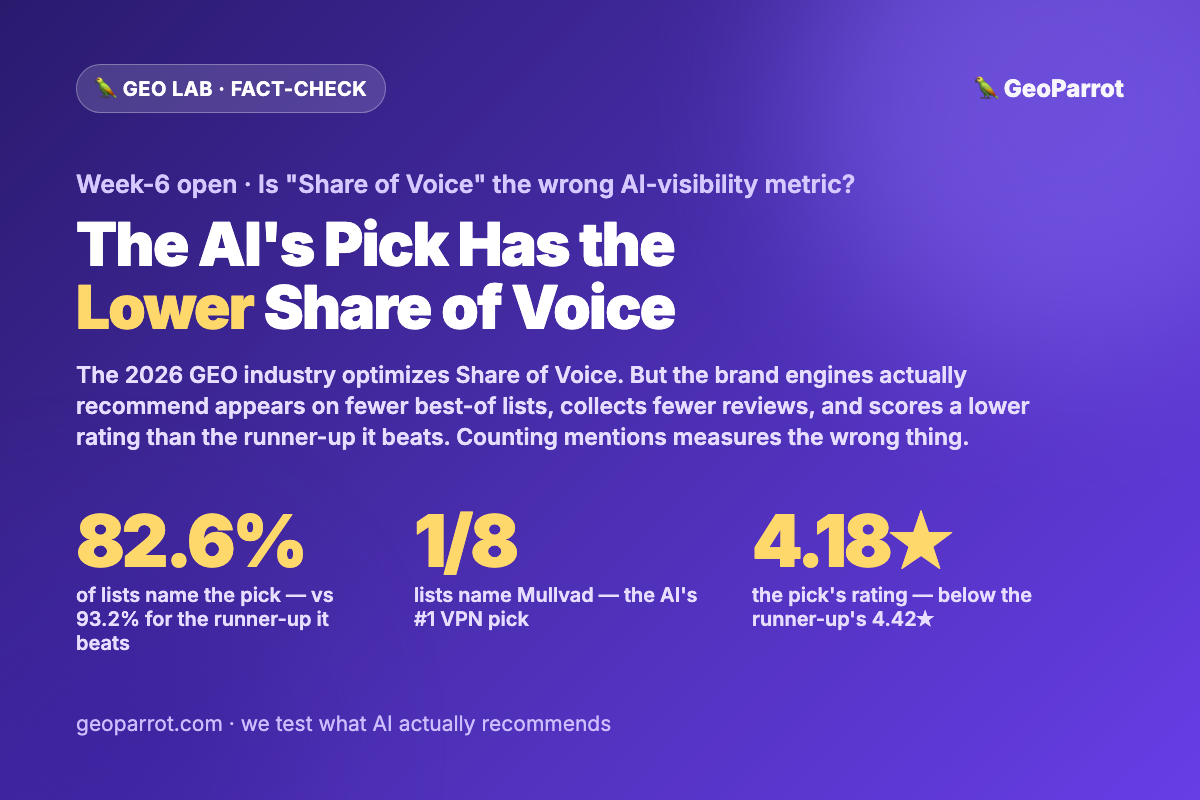
Quick answer: No — Share of Voice (your share of AI brand mentions) is a floor, not a ranking signal, and optimizing toward it can point you at the wrong target. When we tested whether more mentions actually predict which brand AI engines recommend, the consensus pick had less of almost everything than the runner-up it beat: it appeared on 82.6% of its category’s independent best-of lists versus the runner-up’s 93.2%, out-listed that runner-up in only 1 of 6 categories, and carried a lower average review rating (4.18★ vs 4.42★) and fewer reviews. The AI’s #1 VPN pick, Mullvad, appears on just 1 of 8 lists with 176 reviews at 3.5★ — the lowest Share of Voice in its category, and still the pick. So counting mentions measures presence, not the thing that wins the recommendation. This week we test whether you can quantify what does: narrative ownership — how much a brand owns the language of its category in independent text.
This is Monday’s fact-check, and it opens this week’s GEO Lab question: is Share of Voice the right way to measure AI visibility — or should we be quantifying “narrative ownership” instead? Last week we proved that no single third-party counting signal separates the AI consensus pick from its runner-up. That was a qualitative conclusion. This week we turn it into a measurable one — and it lands squarely on the metric the entire 2026 GEO industry is now selling.
What does the “Share of Voice” playbook actually claim?
Through 2026, AI-visibility measurement went from a vibe to a software category. There are now at least nine engines to track and a crowded field of platforms — Profound (widely called the category leader), AthenaHQ, Peec, Otterly, BrandRank and more — built around a single north-star metric: Share of Voice (SoV). The pitch is clean and, on its face, reasonable:
- Share of Voice is your share of the mentions. The standard formula: your brand’s mentions divided by the total mentions across you and your competitor set. Thirty-eight of a hundred-and-twenty total mentions is a 31.7% SoV. Grow the numerator, win the category.
- Mention rate is treated as the headline number. AthenaHQ’s State of AI Search 2026 reports the average brand mention rate across tracked queries is just 17.2%, with leaders far higher — framing “get mentioned more” as the obvious growth lever.
- The premise is that mentions convert to recommendations. The whole optimization loop — more listicle placements, more reviews, more mentions → higher SoV → more business — assumes that the brand mentioned most is the brand recommended most.
That last assumption is the one worth checking. SoV is easy to measure and easy to sell precisely because it’s a count. But a count of mentions is only useful if mentions track the outcome you actually care about: being the brand the engine names as the answer. So we tested it against our own data.
Does a higher Share of Voice actually predict the AI’s pick? (No — the pick has less of almost everything.)
In last week’s experiment we froze the AI consensus picks for 6 buyer-intent categories — the brands two engines independently crowned as the #1 recommendation — and then measured the reputation signals a SoV tool would count, for the pick, its closest runner-up, and a credible challenger. If Share of Voice predicted the pick, the pick should out-count the runner-up on every axis. It did the opposite:
| The signal a Share-of-Voice tool counts | Consensus pick (avg) | Runner-up it beats (avg) | Does more = the pick? |
|---|---|---|---|
| Share of independent best-of lists naming the brand | 82.6% | 93.2% | No — the pick appears on fewer |
| Categories where the pick out-listed its runner-up | 1 of 6 | No | |
| Average review rating | 4.18★ | 4.42★ | No — the pick is rated lower |
| Average review count | ~8,088 | ~8,861 | No — the pick has fewer |
| Top-3 prominence (share of lists placing the brand in the top 3) | 69% | 61% | Weakly — and this is placement quality, not a count |
Read the first four rows together: on every signal a Share-of-Voice dashboard would show you, the brand the engines actually recommend is behind the brand they don’t. It sits on fewer lists, collects fewer reviews, and scores a lower star rating — yet it wins the recommendation. A metric that ranks the runner-up ahead of the winner isn’t measuring the winner. If you optimized purely to close your SoV gap, you’d be copying the brand that lost.
Only the last row breaks the pattern — and it’s telling. Prominence (how often a brand lands in a list’s top 3, not merely somewhere on it) is the one signal that trends with the pick. That’s not a volume count; it’s a measure of how centrally independent sources frame the brand. Which is the first hint that the thing that predicts the pick isn’t how much you’re mentioned, but how you’re mentioned.
Then what separates the pick? (Placement over presence — and one brand with almost no Share of Voice at all.)
The cleanest illustration is the category where SoV fails hardest. The AI’s #1 pick for “best VPN” across engines was Mullvad — a privacy-purist brand that appears on just 1 of 8 independent best-of lists (12.5% breadth, the lowest in the entire study), with 176 reviews at 3.5★. Its runner-up, ExpressVPN, sits on 7 of 8 lists with ~28,000 reviews. By every Share-of-Voice measure ExpressVPN buries Mullvad — a SoV tool would tell Mullvad it’s practically invisible. And yet the engines name Mullvad first.
Why? Because in the independent text engines read, Mullvad owns a concept: it’s the brand privacy writers reach for as the shorthand for “no-logs, anonymous-payment, audited privacy.” It doesn’t need list-breadth because it has narrative ownership of the attribute that defines the query’s intent. That’s the mechanism behind the whole pattern — and it lines up with something we found earlier: engines cite almost entirely different source URLs (just 0.5% overlap across four engines) yet converge on the same recommendation. Divergent sources, convergent conclusion. The only thing that survives across all those different pages is how the brand is described — the language, not the link count. Share of Voice counts the links. It can’t see the language.
To be fair to SoV: it isn’t useless. It behaves like a floor — a brand generally needs some independent presence to be in the running, and Mullvad is the striking exception that proves prose can substitute for reach. But a floor is a pass/fail check, not a ranking dial. Optimizing your Share of Voice tells you whether you exist in the conversation; it does not tell you whether you’ll be picked.
Can we quantify what actually predicts the pick — “narrative ownership”?
Here’s the thread we pull all week. Last week’s verdict named the lever — prose reputation, a brand owning the language of its category — but left it qualitative. “Own the narrative” is only actionable if you can measure it, the way SoV can be measured. So the question that threads this week’s four posts:
- Can narrative ownership be scored? If we count how often each brand is used as the shorthand for its category’s defining attribute in independent prose — “the private one,” “the all-in-one,” “the easy one” — do the consensus picks systematically own more of that language than the runner-ups?
- Does it beat Share of Voice? The real test isn’t whether narrative ownership correlates with the pick — it’s whether it out-predicts mention count on the same frozen roster where SoV just failed. If a brand on fewer lists but with tighter narrative ownership still wins, that’s the metric worth optimizing.
- Is it actionable, or just descriptive? A metric only earns its keep if you can move it. By Friday we want a per-engine read on whether a challenger can earn narrative ownership deliberately, or whether it’s a slow byproduct of category history.
We’ll pre-register the scoring method on Tuesday, run it against the same 18-brand roster midweek, and rule on Friday. The stakes are practical and immediate: brands are pouring budget into tools that optimize a metric which — on our data — ranks the loser above the winner. If narrative ownership out-predicts Share of Voice, the GEO scorecard needs a new top line. If it doesn’t, at least we’ll have tested the industry’s favorite number against the outcome it’s supposed to explain — instead of assuming they’re the same thing.
FAQ
What is Share of Voice in AI search?
It’s your brand’s share of the mentions AI engines make across a set of queries — your mentions divided by the total mentions across you and your competitors. It’s the core metric behind 2026 GEO platforms like Profound, AthenaHQ and Peec, and it’s typically reported alongside “mention rate” (the average brand mention rate across tracked queries was ~17.2% in AthenaHQ’s 2026 report).
Is Share of Voice a bad metric?
Not bad — just incomplete. It works as a floor: a brand usually needs some independent presence to be considered at all. But in our data it fails as a ranking signal — the AI consensus pick appeared on fewer best-of lists, had fewer reviews and a lower rating than the runner-up it beat. Optimizing purely to close a SoV gap can point you at the brand that lost the recommendation.
How can a brand be recommended by AI while appearing on fewer lists?
Because recommendation tracks how a brand is described, not just how often. Our top VPN pick, Mullvad, sits on 1 of 8 lists with 176 reviews yet wins — because in independent prose it owns the concept of “private, no-logs VPN.” That language survives across the many different pages engines read, even though the individual source URLs barely overlap.
What is “narrative ownership”?
It’s the degree to which a brand owns the language of its category — how often independent writers use it as the shorthand for the category’s defining attribute. It’s the qualitative lever we identified last week; this week we test whether it can be scored like a metric and whether it out-predicts Share of Voice at explaining which brand AI engines pick.
Should I stop tracking Share of Voice?
No — track it as a presence check. But don’t treat closing the gap as the goal. Until Friday’s verdict, the practical move is to watch whether you’re being framed centrally in your category (top-3 placements, attribute ownership) rather than merely being mentioned. That placement quality tracked the pick in our data; raw mention volume did not.
Sources
- AthenaHQ — Understanding Share of Voice in AI Search and State of AI Search 2026 (the SoV formula and the 17.2% average mention rate)
- LLM Pulse — Share of Voice in AI Search: How to Calculate It in 2026 (mention rate vs. citation rate vs. SoV definitions)
- Surmado — Best AI Visibility Tools 2026: Profound vs Peec vs Otterly (the SoV-centric tooling landscape)
- GEO Lab — Can You Reverse-Engineer the AI Consensus Pick? The Verdict (no single counting signal separates the pick; prose reputation is the lever)
- GEO Lab — We Scored the AI Consensus Pick Against Its Runner-Ups (the breadth, rating, review-count and Mullvad data in this post)
- GEO Lab — How Does a Brand Become the AI “Consensus” Pick? (consensus exists across engines and can’t be self-manufactured)
- GEO Lab — AI Engines Cite Different Sources — But Do They Agree? (the 0.5% source overlap that makes convergent recommendations so revealing)
Leave a Reply